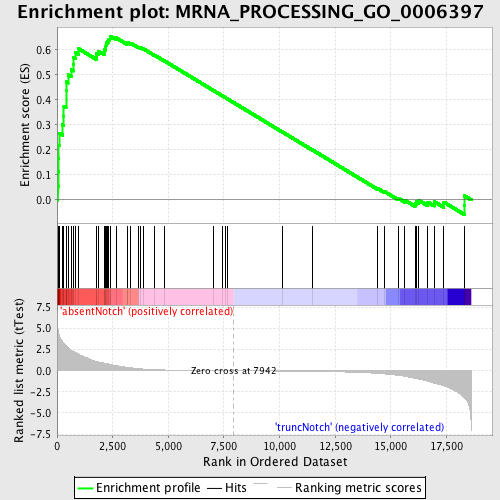
Profile of the Running ES Score & Positions of GeneSet Members on the Rank Ordered List
| Dataset | Set_03_absentNotch_versus_truncNotch.phenotype_absentNotch_versus_truncNotch.cls #absentNotch_versus_truncNotch.phenotype_absentNotch_versus_truncNotch.cls #absentNotch_versus_truncNotch_repos |
| Phenotype | phenotype_absentNotch_versus_truncNotch.cls#absentNotch_versus_truncNotch_repos |
| Upregulated in class | absentNotch |
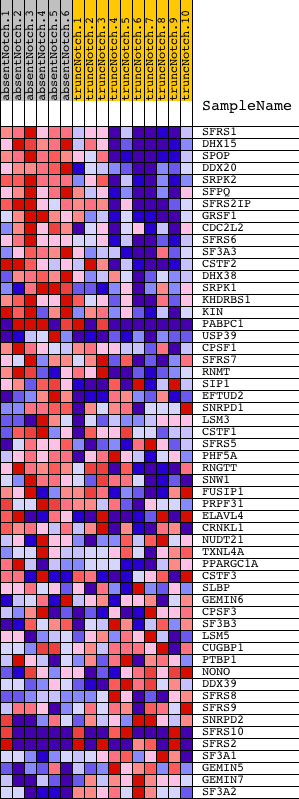
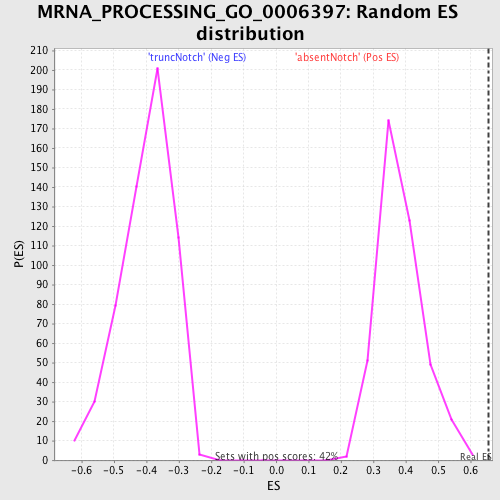
| GeneSet | MRNA_PROCESSING_GO_0006397 |
| Enrichment Score (ES) | 0.65512115 |
| Normalized Enrichment Score (NES) | 1.7127967 |
| Nominal p-value | 0.0 |
| FDR q-value | 0.3076891 |
| FWER p-Value | 0.409 |
| PROBE | DESCRIPTION (from dataset) | GENE SYMBOL | GENE_TITLE | RANK IN GENE LIST | RANK METRIC SCORE | RUNNING ES | CORE ENRICHMENT | |
|---|---|---|---|---|---|---|---|---|
| 1 | SFRS1 | 2360440 | 39 | 4.846 | 0.0554 | Yes | ||
| 2 | DHX15 | 870632 | 44 | 4.807 | 0.1122 | Yes | ||
| 3 | SPOP | 450035 | 60 | 4.589 | 0.1659 | Yes | ||
| 4 | DDX20 | 3290348 | 79 | 4.358 | 0.2166 | Yes | ||
| 5 | SRPK2 | 6380341 | 87 | 4.282 | 0.2671 | Yes | ||
| 6 | SFPQ | 4760110 | 235 | 3.477 | 0.3004 | Yes | ||
| 7 | SFRS2IP | 730687 1500373 | 301 | 3.224 | 0.3352 | Yes | ||
| 8 | GRSF1 | 2100184 | 306 | 3.204 | 0.3730 | Yes | ||
| 9 | CDC2L2 | 1400671 5290168 | 402 | 2.935 | 0.4027 | Yes | ||
| 10 | SFRS6 | 60224 | 403 | 2.933 | 0.4375 | Yes | ||
| 11 | SF3A3 | 6660603 | 408 | 2.919 | 0.4719 | Yes | ||
| 12 | CSTF2 | 6040463 | 491 | 2.727 | 0.4998 | Yes | ||
| 13 | DHX38 | 780243 | 639 | 2.415 | 0.5206 | Yes | ||
| 14 | SRPK1 | 450110 | 733 | 2.264 | 0.5424 | Yes | ||
| 15 | KHDRBS1 | 1240403 6040040 | 741 | 2.247 | 0.5687 | Yes | ||
| 16 | KIN | 6550014 | 837 | 2.124 | 0.5888 | Yes | ||
| 17 | PABPC1 | 2650180 2690253 6020632 1990270 | 972 | 1.920 | 0.6044 | Yes | ||
| 18 | USP39 | 1090242 3520435 4760736 | 1765 | 1.098 | 0.5747 | Yes | ||
| 19 | CPSF1 | 6290064 | 1775 | 1.090 | 0.5872 | Yes | ||
| 20 | SFRS7 | 2760408 | 1858 | 1.040 | 0.5951 | Yes | ||
| 21 | RNMT | 1770500 | 2112 | 0.898 | 0.5921 | Yes | ||
| 22 | SIP1 | 2640706 | 2115 | 0.896 | 0.6026 | Yes | ||
| 23 | EFTUD2 | 2470707 4610148 | 2178 | 0.861 | 0.6095 | Yes | ||
| 24 | SNRPD1 | 4480162 | 2196 | 0.847 | 0.6186 | Yes | ||
| 25 | LSM3 | 780164 | 2208 | 0.841 | 0.6280 | Yes | ||
| 26 | CSTF1 | 4610129 | 2258 | 0.811 | 0.6350 | Yes | ||
| 27 | SFRS5 | 3450176 6350008 | 2327 | 0.778 | 0.6406 | Yes | ||
| 28 | PHF5A | 2690519 | 2377 | 0.753 | 0.6469 | Yes | ||
| 29 | RNGTT | 780152 780746 1090471 | 2390 | 0.749 | 0.6551 | Yes | ||
| 30 | SNW1 | 4010736 | 2659 | 0.608 | 0.6479 | No | ||
| 31 | FUSIP1 | 520082 5390114 | 3143 | 0.410 | 0.6267 | No | ||
| 32 | PRPF31 | 6100360 | 3174 | 0.399 | 0.6299 | No | ||
| 33 | ELAVL4 | 50735 3360086 5220167 | 3310 | 0.352 | 0.6268 | No | ||
| 34 | CRNKL1 | 5050097 | 3665 | 0.248 | 0.6106 | No | ||
| 35 | NUDT21 | 1240167 | 3740 | 0.230 | 0.6094 | No | ||
| 36 | TXNL4A | 4120286 6510242 | 3870 | 0.204 | 0.6048 | No | ||
| 37 | PPARGC1A | 4670040 | 4383 | 0.125 | 0.5787 | No | ||
| 38 | CSTF3 | 3850156 5570458 | 4848 | 0.086 | 0.5548 | No | ||
| 39 | SLBP | 6220601 | 7013 | 0.016 | 0.4384 | No | ||
| 40 | GEMIN6 | 2120288 3830176 | 7431 | 0.009 | 0.4160 | No | ||
| 41 | CPSF3 | 2480671 | 7558 | 0.006 | 0.4093 | No | ||
| 42 | SF3B3 | 3710044 | 7636 | 0.005 | 0.4052 | No | ||
| 43 | LSM5 | 4540398 | 10136 | -0.040 | 0.2710 | No | ||
| 44 | CUGBP1 | 450292 510022 7050176 7050215 | 11467 | -0.073 | 0.2003 | No | ||
| 45 | PTBP1 | 4070736 | 14401 | -0.315 | 0.0460 | No | ||
| 46 | NONO | 7050014 | 14735 | -0.377 | 0.0325 | No | ||
| 47 | DDX39 | 3840148 | 15322 | -0.541 | 0.0073 | No | ||
| 48 | SFRS8 | 5130162 5700164 | 15620 | -0.650 | -0.0009 | No | ||
| 49 | SFRS9 | 3800047 | 16089 | -0.890 | -0.0156 | No | ||
| 50 | SNRPD2 | 6110035 | 16140 | -0.923 | -0.0073 | No | ||
| 51 | SFRS10 | 6130528 6400438 7040112 | 16253 | -0.992 | -0.0016 | No | ||
| 52 | SFRS2 | 50707 380593 | 16661 | -1.237 | -0.0088 | No | ||
| 53 | SF3A1 | 1580315 | 16953 | -1.472 | -0.0070 | No | ||
| 54 | GEMIN5 | 3120577 | 17385 | -1.794 | -0.0090 | No | ||
| 55 | GEMIN7 | 2320433 | 18304 | -3.146 | -0.0211 | No | ||
| 56 | SF3A2 | 3140500 | 18315 | -3.190 | 0.0162 | No |