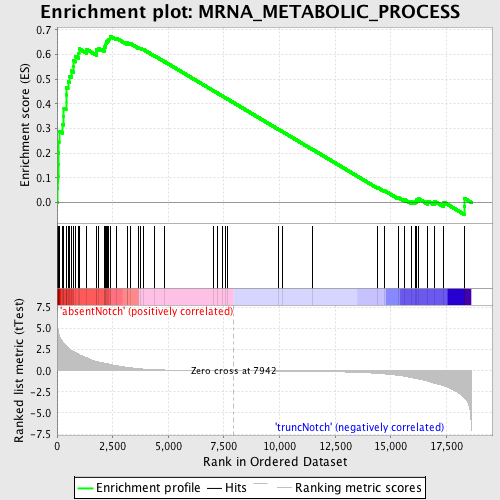
Profile of the Running ES Score & Positions of GeneSet Members on the Rank Ordered List
| Dataset | Set_03_absentNotch_versus_truncNotch.phenotype_absentNotch_versus_truncNotch.cls #absentNotch_versus_truncNotch.phenotype_absentNotch_versus_truncNotch.cls #absentNotch_versus_truncNotch_repos |
| Phenotype | phenotype_absentNotch_versus_truncNotch.cls#absentNotch_versus_truncNotch_repos |
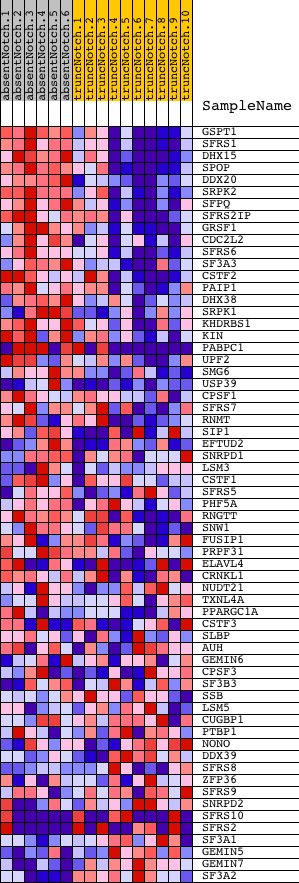
| Upregulated in class | absentNotch |
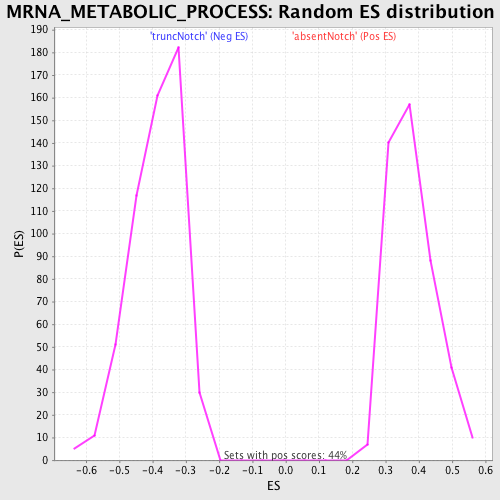
| GeneSet | MRNA_METABOLIC_PROCESS |
| Enrichment Score (ES) | 0.67414564 |
| Normalized Enrichment Score (NES) | 1.7809278 |
| Nominal p-value | 0.0 |
| FDR q-value | 0.13352497 |
| FWER p-Value | 0.101 |
| PROBE | DESCRIPTION (from dataset) | GENE SYMBOL | GENE_TITLE | RANK IN GENE LIST | RANK METRIC SCORE | RUNNING ES | CORE ENRICHMENT | |
|---|---|---|---|---|---|---|---|---|
| 1 | GSPT1 | 5420050 | 18 | 5.469 | 0.0557 | Yes | ||
| 2 | SFRS1 | 2360440 | 39 | 4.846 | 0.1047 | Yes | ||
| 3 | DHX15 | 870632 | 44 | 4.807 | 0.1543 | Yes | ||
| 4 | SPOP | 450035 | 60 | 4.589 | 0.2010 | Yes | ||
| 5 | DDX20 | 3290348 | 79 | 4.358 | 0.2451 | Yes | ||
| 6 | SRPK2 | 6380341 | 87 | 4.282 | 0.2891 | Yes | ||
| 7 | SFPQ | 4760110 | 235 | 3.477 | 0.3172 | Yes | ||
| 8 | SFRS2IP | 730687 1500373 | 301 | 3.224 | 0.3470 | Yes | ||
| 9 | GRSF1 | 2100184 | 306 | 3.204 | 0.3800 | Yes | ||
| 10 | CDC2L2 | 1400671 5290168 | 402 | 2.935 | 0.4053 | Yes | ||
| 11 | SFRS6 | 60224 | 403 | 2.933 | 0.4356 | Yes | ||
| 12 | SF3A3 | 6660603 | 408 | 2.919 | 0.4656 | Yes | ||
| 13 | CSTF2 | 6040463 | 491 | 2.727 | 0.4894 | Yes | ||
| 14 | PAIP1 | 3870576 | 563 | 2.557 | 0.5121 | Yes | ||
| 15 | DHX38 | 780243 | 639 | 2.415 | 0.5330 | Yes | ||
| 16 | SRPK1 | 450110 | 733 | 2.264 | 0.5515 | Yes | ||
| 17 | KHDRBS1 | 1240403 6040040 | 741 | 2.247 | 0.5743 | Yes | ||
| 18 | KIN | 6550014 | 837 | 2.124 | 0.5912 | Yes | ||
| 19 | PABPC1 | 2650180 2690253 6020632 1990270 | 972 | 1.920 | 0.6039 | Yes | ||
| 20 | UPF2 | 4810471 | 985 | 1.906 | 0.6230 | Yes | ||
| 21 | SMG6 | 5820243 | 1318 | 1.530 | 0.6209 | Yes | ||
| 22 | USP39 | 1090242 3520435 4760736 | 1765 | 1.098 | 0.6082 | Yes | ||
| 23 | CPSF1 | 6290064 | 1775 | 1.090 | 0.6190 | Yes | ||
| 24 | SFRS7 | 2760408 | 1858 | 1.040 | 0.6254 | Yes | ||
| 25 | RNMT | 1770500 | 2112 | 0.898 | 0.6210 | Yes | ||
| 26 | SIP1 | 2640706 | 2115 | 0.896 | 0.6302 | Yes | ||
| 27 | EFTUD2 | 2470707 4610148 | 2178 | 0.861 | 0.6358 | Yes | ||
| 28 | SNRPD1 | 4480162 | 2196 | 0.847 | 0.6436 | Yes | ||
| 29 | LSM3 | 780164 | 2208 | 0.841 | 0.6517 | Yes | ||
| 30 | CSTF1 | 4610129 | 2258 | 0.811 | 0.6575 | Yes | ||
| 31 | SFRS5 | 3450176 6350008 | 2327 | 0.778 | 0.6619 | Yes | ||
| 32 | PHF5A | 2690519 | 2377 | 0.753 | 0.6670 | Yes | ||
| 33 | RNGTT | 780152 780746 1090471 | 2390 | 0.749 | 0.6741 | Yes | ||
| 34 | SNW1 | 4010736 | 2659 | 0.608 | 0.6660 | No | ||
| 35 | FUSIP1 | 520082 5390114 | 3143 | 0.410 | 0.6442 | No | ||
| 36 | PRPF31 | 6100360 | 3174 | 0.399 | 0.6467 | No | ||
| 37 | ELAVL4 | 50735 3360086 5220167 | 3310 | 0.352 | 0.6431 | No | ||
| 38 | CRNKL1 | 5050097 | 3665 | 0.248 | 0.6266 | No | ||
| 39 | NUDT21 | 1240167 | 3740 | 0.230 | 0.6250 | No | ||
| 40 | TXNL4A | 4120286 6510242 | 3870 | 0.204 | 0.6201 | No | ||
| 41 | PPARGC1A | 4670040 | 4383 | 0.125 | 0.5938 | No | ||
| 42 | CSTF3 | 3850156 5570458 | 4848 | 0.086 | 0.5697 | No | ||
| 43 | SLBP | 6220601 | 7013 | 0.016 | 0.4532 | No | ||
| 44 | AUH | 5570152 | 7200 | 0.013 | 0.4434 | No | ||
| 45 | GEMIN6 | 2120288 3830176 | 7431 | 0.009 | 0.4310 | No | ||
| 46 | CPSF3 | 2480671 | 7558 | 0.006 | 0.4243 | No | ||
| 47 | SF3B3 | 3710044 | 7636 | 0.005 | 0.4202 | No | ||
| 48 | SSB | 460286 3140717 | 9929 | -0.035 | 0.2971 | No | ||
| 49 | LSM5 | 4540398 | 10136 | -0.040 | 0.2864 | No | ||
| 50 | CUGBP1 | 450292 510022 7050176 7050215 | 11467 | -0.073 | 0.2154 | No | ||
| 51 | PTBP1 | 4070736 | 14401 | -0.315 | 0.0606 | No | ||
| 52 | NONO | 7050014 | 14735 | -0.377 | 0.0466 | No | ||
| 53 | DDX39 | 3840148 | 15322 | -0.541 | 0.0206 | No | ||
| 54 | SFRS8 | 5130162 5700164 | 15620 | -0.650 | 0.0113 | No | ||
| 55 | ZFP36 | 2030605 | 15943 | -0.812 | 0.0024 | No | ||
| 56 | SFRS9 | 3800047 | 16089 | -0.890 | 0.0038 | No | ||
| 57 | SNRPD2 | 6110035 | 16140 | -0.923 | 0.0106 | No | ||
| 58 | SFRS10 | 6130528 6400438 7040112 | 16253 | -0.992 | 0.0149 | No | ||
| 59 | SFRS2 | 50707 380593 | 16661 | -1.237 | 0.0057 | No | ||
| 60 | SF3A1 | 1580315 | 16953 | -1.472 | 0.0053 | No | ||
| 61 | GEMIN5 | 3120577 | 17385 | -1.794 | 0.0006 | No | ||
| 62 | GEMIN7 | 2320433 | 18304 | -3.146 | -0.0163 | No | ||
| 63 | SF3A2 | 3140500 | 18315 | -3.190 | 0.0162 | No |