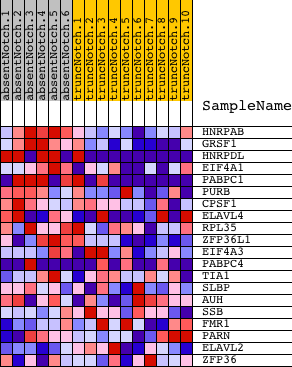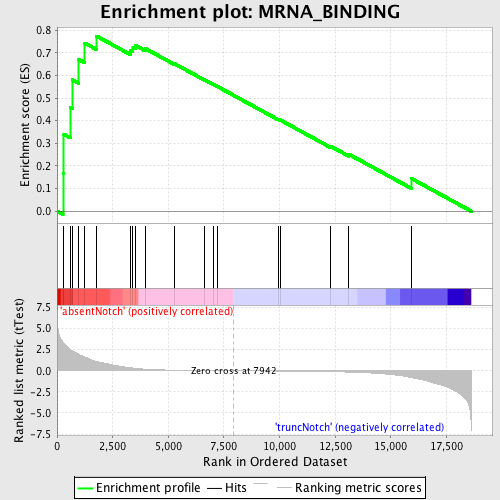
Profile of the Running ES Score & Positions of GeneSet Members on the Rank Ordered List
| Dataset | Set_03_absentNotch_versus_truncNotch.phenotype_absentNotch_versus_truncNotch.cls #absentNotch_versus_truncNotch.phenotype_absentNotch_versus_truncNotch.cls #absentNotch_versus_truncNotch_repos |
| Phenotype | phenotype_absentNotch_versus_truncNotch.cls#absentNotch_versus_truncNotch_repos |
| Upregulated in class | absentNotch |
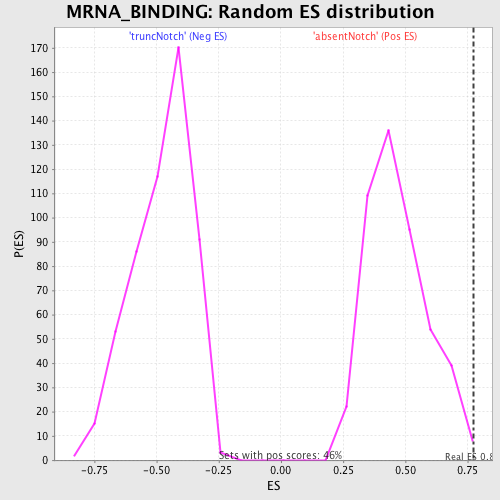
| GeneSet | MRNA_BINDING |
| Enrichment Score (ES) | 0.7734685 |
| Normalized Enrichment Score (NES) | 1.648976 |
| Nominal p-value | 0.0021598272 |
| FDR q-value | 0.37327892 |
| FWER p-Value | 0.794 |
| PROBE | DESCRIPTION (from dataset) | GENE SYMBOL | GENE_TITLE | RANK IN GENE LIST | RANK METRIC SCORE | RUNNING ES | CORE ENRICHMENT | |
|---|---|---|---|---|---|---|---|---|
| 1 | HNRPAB | 540504 | 266 | 3.358 | 0.1679 | Yes | ||
| 2 | GRSF1 | 2100184 | 306 | 3.204 | 0.3397 | Yes | ||
| 3 | HNRPDL | 1050102 1090181 5360471 | 603 | 2.480 | 0.4584 | Yes | ||
| 4 | EIF4A1 | 1990341 2810300 | 687 | 2.341 | 0.5810 | Yes | ||
| 5 | PABPC1 | 2650180 2690253 6020632 1990270 | 972 | 1.920 | 0.6700 | Yes | ||
| 6 | PURB | 5360138 | 1249 | 1.611 | 0.7425 | Yes | ||
| 7 | CPSF1 | 6290064 | 1775 | 1.090 | 0.7735 | Yes | ||
| 8 | ELAVL4 | 50735 3360086 5220167 | 3310 | 0.352 | 0.7101 | No | ||
| 9 | RPL35 | 6940070 | 3410 | 0.325 | 0.7224 | No | ||
| 10 | ZFP36L1 | 2510138 4120048 | 3513 | 0.292 | 0.7328 | No | ||
| 11 | EIF4A3 | 3440538 | 3962 | 0.185 | 0.7188 | No | ||
| 12 | PABPC4 | 1990170 6760270 5390138 | 5287 | 0.063 | 0.6510 | No | ||
| 13 | TIA1 | 4670373 | 6641 | 0.024 | 0.5796 | No | ||
| 14 | SLBP | 6220601 | 7013 | 0.016 | 0.5605 | No | ||
| 15 | AUH | 5570152 | 7200 | 0.013 | 0.5512 | No | ||
| 16 | SSB | 460286 3140717 | 9929 | -0.035 | 0.4064 | No | ||
| 17 | FMR1 | 5050075 | 10022 | -0.037 | 0.4035 | No | ||
| 18 | PARN | 3840129 | 12284 | -0.106 | 0.2877 | No | ||
| 19 | ELAVL2 | 360181 | 13114 | -0.159 | 0.2517 | No | ||
| 20 | ZFP36 | 2030605 | 15943 | -0.812 | 0.1437 | No |