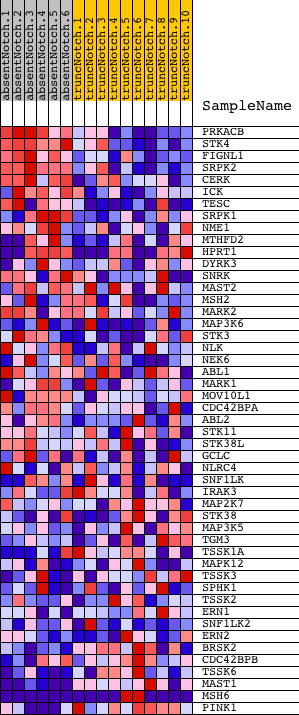
Profile of the Running ES Score & Positions of GeneSet Members on the Rank Ordered List
| Dataset | Set_03_absentNotch_versus_truncNotch.phenotype_absentNotch_versus_truncNotch.cls #absentNotch_versus_truncNotch.phenotype_absentNotch_versus_truncNotch.cls #absentNotch_versus_truncNotch_repos |
| Phenotype | phenotype_absentNotch_versus_truncNotch.cls#absentNotch_versus_truncNotch_repos |
| Upregulated in class | absentNotch |
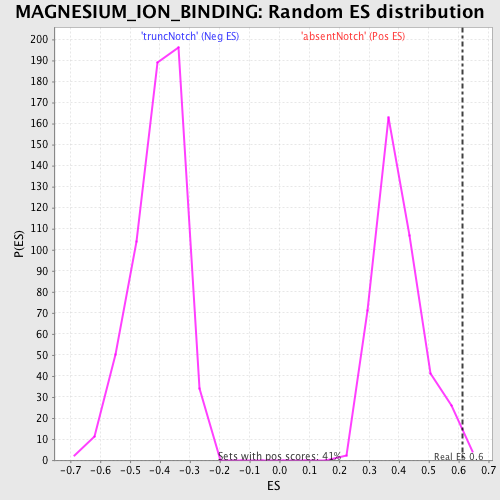
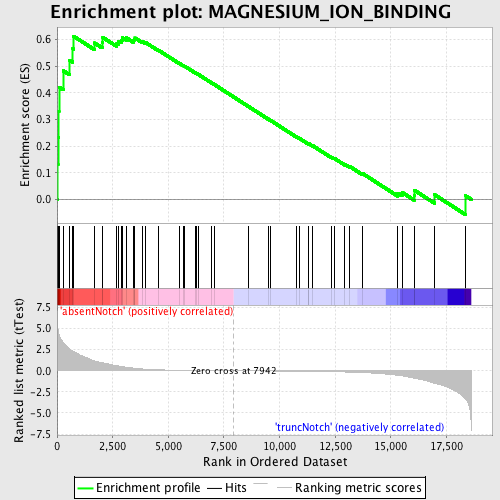
| GeneSet | MAGNESIUM_ION_BINDING |
| Enrichment Score (ES) | 0.6122176 |
| Normalized Enrichment Score (NES) | 1.535244 |
| Nominal p-value | 0.009661836 |
| FDR q-value | 0.7108277 |
| FWER p-Value | 1.0 |
| PROBE | DESCRIPTION (from dataset) | GENE SYMBOL | GENE_TITLE | RANK IN GENE LIST | RANK METRIC SCORE | RUNNING ES | CORE ENRICHMENT | |
|---|---|---|---|---|---|---|---|---|
| 1 | PRKACB | 4210170 | 9 | 6.062 | 0.1308 | Yes | ||
| 2 | STK4 | 2640152 | 43 | 4.814 | 0.2333 | Yes | ||
| 3 | FIGNL1 | 6860390 | 69 | 4.471 | 0.3288 | Yes | ||
| 4 | SRPK2 | 6380341 | 87 | 4.282 | 0.4207 | Yes | ||
| 5 | CERK | 110397 670168 | 275 | 3.322 | 0.4826 | Yes | ||
| 6 | ICK | 1580746 3140021 | 568 | 2.543 | 0.5219 | Yes | ||
| 7 | TESC | 6550273 | 706 | 2.309 | 0.5646 | Yes | ||
| 8 | SRPK1 | 450110 | 733 | 2.264 | 0.6122 | Yes | ||
| 9 | NME1 | 770014 | 1678 | 1.164 | 0.5866 | No | ||
| 10 | MTHFD2 | 3800411 | 2029 | 0.949 | 0.5883 | No | ||
| 11 | HPRT1 | 1690398 4920619 6350170 | 2053 | 0.937 | 0.6074 | No | ||
| 12 | DYRK3 | 1090014 | 2684 | 0.592 | 0.5863 | No | ||
| 13 | SNRK | 630021 2030731 6350017 | 2768 | 0.554 | 0.5938 | No | ||
| 14 | MAST2 | 6200348 | 2905 | 0.496 | 0.5972 | No | ||
| 15 | MSH2 | 6180273 | 2927 | 0.488 | 0.6067 | No | ||
| 16 | MARK2 | 7210608 | 3106 | 0.424 | 0.6063 | No | ||
| 17 | MAP3K6 | 6400390 | 3420 | 0.320 | 0.5963 | No | ||
| 18 | STK3 | 7100427 | 3462 | 0.306 | 0.6008 | No | ||
| 19 | NLK | 2030010 2450041 | 3499 | 0.295 | 0.6052 | No | ||
| 20 | NEK6 | 3360687 | 3818 | 0.213 | 0.5927 | No | ||
| 21 | ABL1 | 1050593 2030050 4010114 | 3953 | 0.186 | 0.5895 | No | ||
| 22 | MARK1 | 450484 | 4561 | 0.108 | 0.5592 | No | ||
| 23 | MOV10L1 | 4050411 | 5490 | 0.055 | 0.5104 | No | ||
| 24 | CDC42BPA | 840671 | 5661 | 0.050 | 0.5023 | No | ||
| 25 | ABL2 | 580021 | 5734 | 0.047 | 0.4995 | No | ||
| 26 | STK11 | 6550278 | 6215 | 0.033 | 0.4743 | No | ||
| 27 | STK38L | 840133 | 6265 | 0.032 | 0.4724 | No | ||
| 28 | GCLC | 2810731 | 6370 | 0.030 | 0.4674 | No | ||
| 29 | NLRC4 | 5570332 | 6946 | 0.018 | 0.4369 | No | ||
| 30 | SNF1LK | 6110403 | 7064 | 0.016 | 0.4309 | No | ||
| 31 | IRAK3 | 4050102 | 8601 | -0.011 | 0.3484 | No | ||
| 32 | MAP2K7 | 2260086 | 9480 | -0.026 | 0.3017 | No | ||
| 33 | STK38 | 7100114 | 9583 | -0.028 | 0.2968 | No | ||
| 34 | MAP3K5 | 6020041 6380162 | 10776 | -0.054 | 0.2338 | No | ||
| 35 | TGM3 | 840576 | 10886 | -0.056 | 0.2291 | No | ||
| 36 | TSSK1A | 4480537 | 11295 | -0.067 | 0.2086 | No | ||
| 37 | MAPK12 | 450022 1340717 7050484 | 11301 | -0.068 | 0.2098 | No | ||
| 38 | TSSK3 | 1740673 | 11488 | -0.074 | 0.2014 | No | ||
| 39 | SPHK1 | 2470113 4230398 6220397 | 12336 | -0.109 | 0.1581 | No | ||
| 40 | TSSK2 | 5220324 | 12458 | -0.115 | 0.1541 | No | ||
| 41 | ERN1 | 2360403 | 12930 | -0.146 | 0.1319 | No | ||
| 42 | SNF1LK2 | 4280739 2480463 | 13161 | -0.163 | 0.1230 | No | ||
| 43 | ERN2 | 7000411 | 13725 | -0.219 | 0.0975 | No | ||
| 44 | BRSK2 | 4050292 | 15311 | -0.536 | 0.0237 | No | ||
| 45 | CDC42BPB | 6350037 | 15510 | -0.605 | 0.0262 | No | ||
| 46 | TSSK6 | 2190136 | 16048 | -0.868 | 0.0160 | No | ||
| 47 | MAST1 | 6940215 | 16059 | -0.872 | 0.0344 | No | ||
| 48 | MSH6 | 4480064 6520093 | 16967 | -1.483 | 0.0177 | No | ||
| 49 | PINK1 | 380044 580577 | 18345 | -3.282 | 0.0146 | No |