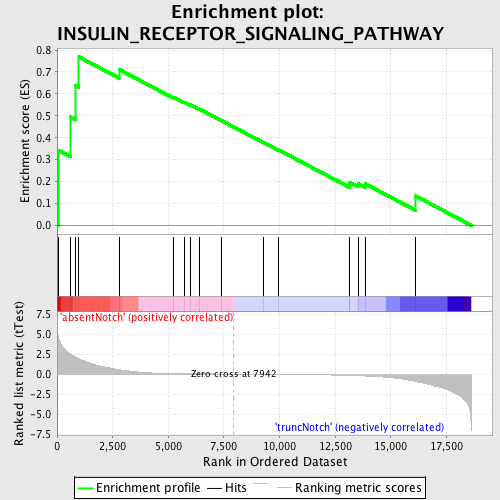
Profile of the Running ES Score & Positions of GeneSet Members on the Rank Ordered List
| Dataset | Set_03_absentNotch_versus_truncNotch.phenotype_absentNotch_versus_truncNotch.cls #absentNotch_versus_truncNotch.phenotype_absentNotch_versus_truncNotch.cls #absentNotch_versus_truncNotch_repos |
| Phenotype | phenotype_absentNotch_versus_truncNotch.cls#absentNotch_versus_truncNotch_repos |
| Upregulated in class | absentNotch |
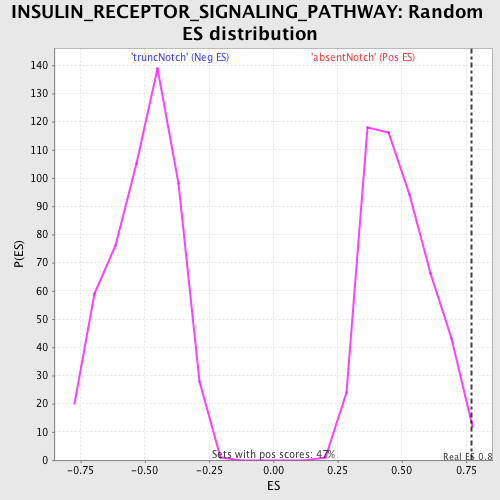
| GeneSet | INSULIN_RECEPTOR_SIGNALING_PATHWAY |
| Enrichment Score (ES) | 0.76900226 |
| Normalized Enrichment Score (NES) | 1.5755533 |
| Nominal p-value | 0.010548524 |
| FDR q-value | 0.61788714 |
| FWER p-Value | 0.988 |
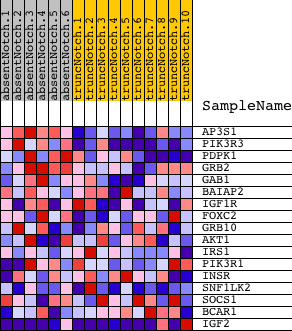
| PROBE | DESCRIPTION (from dataset) | GENE SYMBOL | GENE_TITLE | RANK IN GENE LIST | RANK METRIC SCORE | RUNNING ES | CORE ENRICHMENT | |
|---|---|---|---|---|---|---|---|---|
| 1 | AP3S1 | 5570044 | 48 | 4.776 | 0.3439 | Yes | ||
| 2 | PIK3R3 | 1770333 | 596 | 2.488 | 0.4949 | Yes | ||
| 3 | PDPK1 | 6650168 | 815 | 2.154 | 0.6394 | Yes | ||
| 4 | GRB2 | 6650398 | 982 | 1.909 | 0.7690 | Yes | ||
| 5 | GAB1 | 2970156 | 2785 | 0.546 | 0.7117 | No | ||
| 6 | BAIAP2 | 460347 4730600 | 5236 | 0.065 | 0.5848 | No | ||
| 7 | IGF1R | 3360494 | 5719 | 0.048 | 0.5623 | No | ||
| 8 | FOXC2 | 4150041 | 5974 | 0.040 | 0.5516 | No | ||
| 9 | GRB10 | 6980082 | 6400 | 0.029 | 0.5308 | No | ||
| 10 | AKT1 | 5290746 | 7382 | 0.010 | 0.4788 | No | ||
| 11 | IRS1 | 1190204 | 9291 | -0.023 | 0.3779 | No | ||
| 12 | PIK3R1 | 4730671 | 9937 | -0.035 | 0.3457 | No | ||
| 13 | INSR | 1190504 | 13136 | -0.161 | 0.1855 | No | ||
| 14 | SNF1LK2 | 4280739 2480463 | 13161 | -0.163 | 0.1960 | No | ||
| 15 | SOCS1 | 730139 | 13530 | -0.195 | 0.1903 | No | ||
| 16 | BCAR1 | 1340215 | 13843 | -0.233 | 0.1904 | No | ||
| 17 | IGF2 | 6510020 | 16119 | -0.911 | 0.1342 | No |