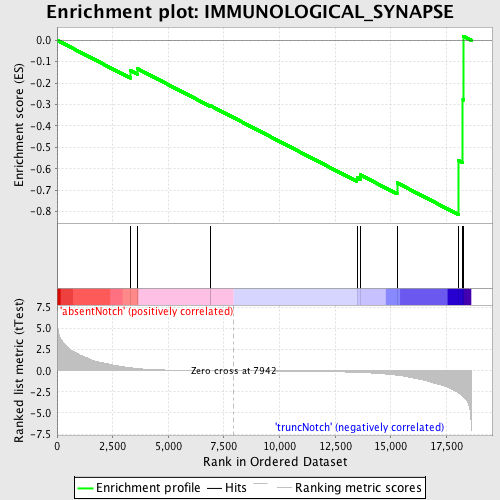
Profile of the Running ES Score & Positions of GeneSet Members on the Rank Ordered List
| Dataset | Set_03_absentNotch_versus_truncNotch.phenotype_absentNotch_versus_truncNotch.cls #absentNotch_versus_truncNotch.phenotype_absentNotch_versus_truncNotch.cls #absentNotch_versus_truncNotch_repos |
| Phenotype | phenotype_absentNotch_versus_truncNotch.cls#absentNotch_versus_truncNotch_repos |
| Upregulated in class | truncNotch |
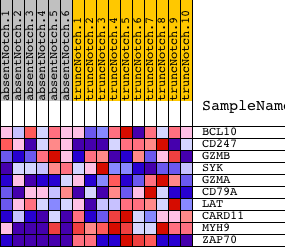
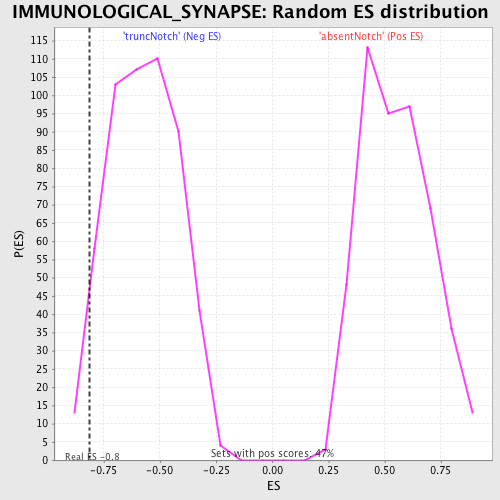
| GeneSet | IMMUNOLOGICAL_SYNAPSE |
| Enrichment Score (ES) | -0.81348544 |
| Normalized Enrichment Score (NES) | -1.4254175 |
| Nominal p-value | 0.038022812 |
| FDR q-value | 1.0 |
| FWER p-Value | 1.0 |
| PROBE | DESCRIPTION (from dataset) | GENE SYMBOL | GENE_TITLE | RANK IN GENE LIST | RANK METRIC SCORE | RUNNING ES | CORE ENRICHMENT | |
|---|---|---|---|---|---|---|---|---|
| 1 | BCL10 | 2360397 | 3285 | 0.361 | -0.1412 | No | ||
| 2 | CD247 | 3800725 5720136 | 3605 | 0.264 | -0.1326 | No | ||
| 3 | GZMB | 380066 | 6895 | 0.018 | -0.3075 | No | ||
| 4 | SYK | 6940133 | 6907 | 0.018 | -0.3063 | No | ||
| 5 | GZMA | 3390315 | 13479 | -0.189 | -0.6409 | No | ||
| 6 | CD79A | 3450563 | 13623 | -0.208 | -0.6283 | No | ||
| 7 | LAT | 3170025 | 15281 | -0.527 | -0.6658 | Yes | ||
| 8 | CARD11 | 70338 | 18030 | -2.591 | -0.5600 | Yes | ||
| 9 | MYH9 | 3120091 4850292 | 18242 | -2.994 | -0.2783 | Yes | ||
| 10 | ZAP70 | 1410494 2260504 | 18258 | -3.049 | 0.0192 | Yes |