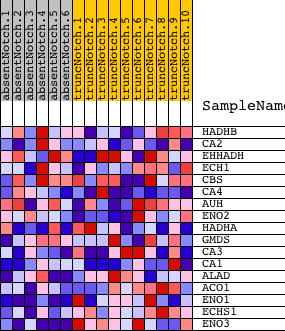
Profile of the Running ES Score & Positions of GeneSet Members on the Rank Ordered List
| Dataset | Set_03_absentNotch_versus_truncNotch.phenotype_absentNotch_versus_truncNotch.cls #absentNotch_versus_truncNotch.phenotype_absentNotch_versus_truncNotch.cls #absentNotch_versus_truncNotch_repos |
| Phenotype | phenotype_absentNotch_versus_truncNotch.cls#absentNotch_versus_truncNotch_repos |
| Upregulated in class | truncNotch |
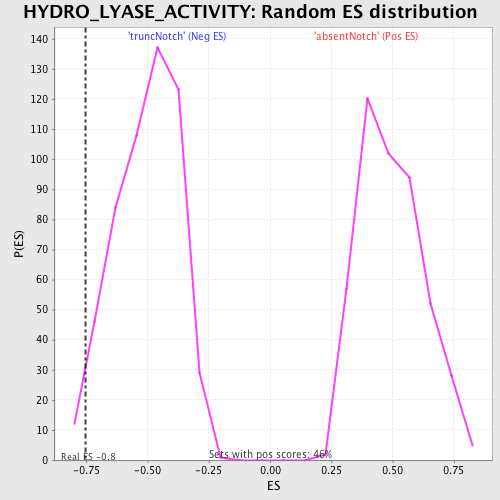
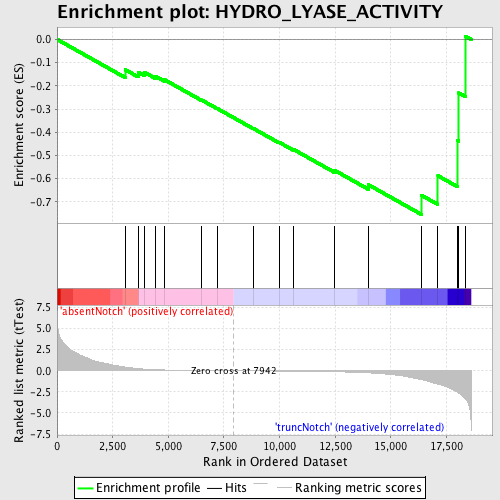
| GeneSet | HYDRO_LYASE_ACTIVITY |
| Enrichment Score (ES) | -0.75406563 |
| Normalized Enrichment Score (NES) | -1.5079058 |
| Nominal p-value | 0.024074074 |
| FDR q-value | 0.8972183 |
| FWER p-Value | 1.0 |
| PROBE | DESCRIPTION (from dataset) | GENE SYMBOL | GENE_TITLE | RANK IN GENE LIST | RANK METRIC SCORE | RUNNING ES | CORE ENRICHMENT | |
|---|---|---|---|---|---|---|---|---|
| 1 | HADHB | 60064 2690670 | 3063 | 0.436 | -0.1303 | No | ||
| 2 | CA2 | 1660113 1660600 | 3647 | 0.253 | -0.1418 | No | ||
| 3 | EHHADH | 6200315 | 3931 | 0.191 | -0.1419 | No | ||
| 4 | ECH1 | 4120746 | 4408 | 0.122 | -0.1579 | No | ||
| 5 | CBS | 5420450 6660039 | 4827 | 0.087 | -0.1735 | No | ||
| 6 | CA4 | 130100 | 6492 | 0.027 | -0.2608 | No | ||
| 7 | AUH | 5570152 | 7200 | 0.013 | -0.2978 | No | ||
| 8 | ENO2 | 2320068 | 8820 | -0.015 | -0.3837 | No | ||
| 9 | HADHA | 3190041 | 9974 | -0.036 | -0.4428 | No | ||
| 10 | GMDS | 1050519 | 10607 | -0.050 | -0.4728 | No | ||
| 11 | CA3 | 870687 5890390 | 12462 | -0.116 | -0.5634 | No | ||
| 12 | CA1 | 1340204 | 13985 | -0.250 | -0.6255 | No | ||
| 13 | ALAD | 780576 | 16377 | -1.050 | -0.6712 | Yes | ||
| 14 | ACO1 | 50114 | 17117 | -1.570 | -0.5872 | Yes | ||
| 15 | ENO1 | 5340128 | 17995 | -2.530 | -0.4348 | Yes | ||
| 16 | ECHS1 | 2970184 | 18056 | -2.631 | -0.2306 | Yes | ||
| 17 | ENO3 | 5270136 | 18352 | -3.305 | 0.0142 | Yes |