Profile of the Running ES Score & Positions of GeneSet Members on the Rank Ordered List
| Dataset | Set_03_absentNotch_versus_truncNotch.phenotype_absentNotch_versus_truncNotch.cls #absentNotch_versus_truncNotch.phenotype_absentNotch_versus_truncNotch.cls #absentNotch_versus_truncNotch_repos |
| Phenotype | phenotype_absentNotch_versus_truncNotch.cls#absentNotch_versus_truncNotch_repos |
| Upregulated in class | absentNotch |
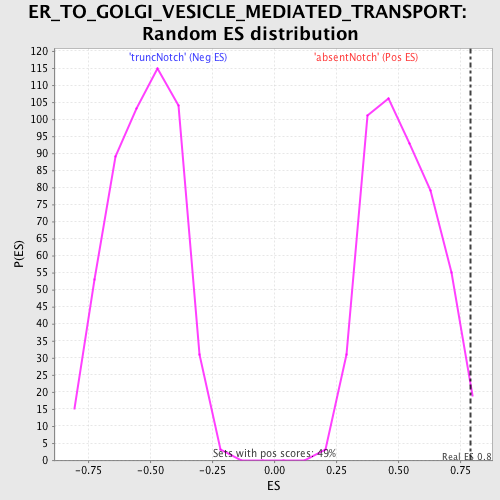
| GeneSet | ER_TO_GOLGI_VESICLE_MEDIATED_TRANSPORT |
| Enrichment Score (ES) | 0.7903114 |
| Normalized Enrichment Score (NES) | 1.5330434 |
| Nominal p-value | 0.018480493 |
| FDR q-value | 0.6331001 |
| FWER p-Value | 1.0 |
| PROBE | DESCRIPTION (from dataset) | GENE SYMBOL | GENE_TITLE | RANK IN GENE LIST | RANK METRIC SCORE | RUNNING ES | CORE ENRICHMENT | |
|---|---|---|---|---|---|---|---|---|
| 1 | RAB2A | 2450358 | 27 | 5.135 | 0.2395 | Yes | ||
| 2 | LMAN1 | 3420068 | 167 | 3.768 | 0.4089 | Yes | ||
| 3 | NRBP1 | 1740750 | 730 | 2.272 | 0.4853 | Yes | ||
| 4 | COG3 | 3840746 | 919 | 2.015 | 0.5697 | Yes | ||
| 5 | TXNDC1 | 520398 | 1105 | 1.771 | 0.6429 | Yes | ||
| 6 | LMAN2L | 50079 6590100 6650338 | 1225 | 1.644 | 0.7137 | Yes | ||
| 7 | ZW10 | 2900735 3520687 | 1231 | 1.639 | 0.7903 | Yes | ||
| 8 | STX18 | 4760706 | 2775 | 0.550 | 0.7332 | No | ||
| 9 | SEC22B | 3190278 | 3412 | 0.324 | 0.7142 | No | ||
| 10 | SEC22A | 3800162 3840168 5220164 5290632 | 4911 | 0.082 | 0.6375 | No | ||
| 11 | BET1 | 4010725 | 8281 | -0.006 | 0.4567 | No | ||
| 12 | GOSR2 | 1850059 1980687 4590184 | 14191 | -0.279 | 0.1522 | No | ||
| 13 | SEC22C | 1050600 6760050 | 14417 | -0.318 | 0.1550 | No | ||
| 14 | ERGIC3 | 1400075 4780047 | 17012 | -1.505 | 0.0862 | No |