Profile of the Running ES Score & Positions of GeneSet Members on the Rank Ordered List
| Dataset | Set_03_absentNotch_versus_truncNotch.phenotype_absentNotch_versus_truncNotch.cls #absentNotch_versus_truncNotch.phenotype_absentNotch_versus_truncNotch.cls #absentNotch_versus_truncNotch_repos |
| Phenotype | phenotype_absentNotch_versus_truncNotch.cls#absentNotch_versus_truncNotch_repos |
| Upregulated in class | truncNotch |
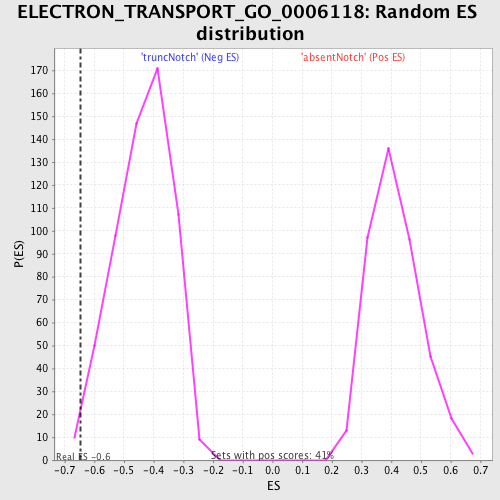
| GeneSet | ELECTRON_TRANSPORT_GO_0006118 |
| Enrichment Score (ES) | -0.6470701 |
| Normalized Enrichment Score (NES) | -1.488802 |
| Nominal p-value | 0.010135135 |
| FDR q-value | 1.0 |
| FWER p-Value | 1.0 |
| PROBE | DESCRIPTION (from dataset) | GENE SYMBOL | GENE_TITLE | RANK IN GENE LIST | RANK METRIC SCORE | RUNNING ES | CORE ENRICHMENT | |
|---|---|---|---|---|---|---|---|---|
| 1 | DHRS4 | 630670 | 1321 | 1.528 | -0.0224 | No | ||
| 2 | CYP1B1 | 4760735 | 1693 | 1.156 | -0.0056 | No | ||
| 3 | SLC25A13 | 4920072 5690722 | 2050 | 0.939 | 0.0051 | No | ||
| 4 | MTRR | 4060358 5910373 6180397 | 3382 | 0.334 | -0.0559 | No | ||
| 5 | AOC3 | 6840129 | 3596 | 0.266 | -0.0589 | No | ||
| 6 | ALDH9A1 | 4810047 | 4515 | 0.112 | -0.1047 | No | ||
| 7 | SDHC | 3140347 6100156 | 4633 | 0.102 | -0.1078 | No | ||
| 8 | NNT | 540253 1170471 5550092 6760397 | 5604 | 0.052 | -0.1583 | No | ||
| 9 | AKR1D1 | 6770026 | 5790 | 0.045 | -0.1668 | No | ||
| 10 | NOX4 | 6040136 | 6087 | 0.037 | -0.1816 | No | ||
| 11 | PLOD1 | 6040427 | 6398 | 0.029 | -0.1973 | No | ||
| 12 | SDHA | 7000056 | 7188 | 0.013 | -0.2394 | No | ||
| 13 | DUOX2 | 1410575 | 7572 | 0.006 | -0.2598 | No | ||
| 14 | CYP24A1 | 2340338 | 7947 | -0.000 | -0.2799 | No | ||
| 15 | CDO1 | 2480279 | 8582 | -0.011 | -0.3137 | No | ||
| 16 | DHRS2 | 4200577 | 9435 | -0.025 | -0.3588 | No | ||
| 17 | ADH7 | 60465 | 9735 | -0.031 | -0.3739 | No | ||
| 18 | TXNL1 | 2850148 | 10059 | -0.038 | -0.3900 | No | ||
| 19 | HCCS | 670397 3170341 | 10550 | -0.049 | -0.4149 | No | ||
| 20 | BLVRA | 360088 | 12749 | -0.133 | -0.5289 | No | ||
| 21 | DUOX1 | 4480047 | 14945 | -0.425 | -0.6335 | Yes | ||
| 22 | ALDH3A1 | 580095 | 15002 | -0.437 | -0.6226 | Yes | ||
| 23 | WWOX | 510008 870524 1090114 | 15454 | -0.588 | -0.6282 | Yes | ||
| 24 | ALDH5A1 | 7040750 | 15577 | -0.634 | -0.6146 | Yes | ||
| 25 | POR | 70494 6100093 | 15871 | -0.779 | -0.6055 | Yes | ||
| 26 | FDXR | 2100576 5910528 | 16274 | -1.000 | -0.5953 | Yes | ||
| 27 | NDOR1 | 4200066 | 16350 | -1.037 | -0.5663 | Yes | ||
| 28 | SURF1 | 5130048 | 16395 | -1.064 | -0.5348 | Yes | ||
| 29 | GPX4 | 5080433 | 16508 | -1.138 | -0.5046 | Yes | ||
| 30 | SPR | 6840170 | 16690 | -1.259 | -0.4742 | Yes | ||
| 31 | LOXL1 | 3520537 | 16936 | -1.463 | -0.4408 | Yes | ||
| 32 | FXN | 4070500 | 17110 | -1.568 | -0.4002 | Yes | ||
| 33 | UQCRC1 | 520053 | 17166 | -1.607 | -0.3520 | Yes | ||
| 34 | SLC25A12 | 7400731 | 17566 | -1.964 | -0.3109 | Yes | ||
| 35 | PGD | 6840048 | 17741 | -2.174 | -0.2511 | Yes | ||
| 36 | PPOX | 2640678 3850102 | 17956 | -2.473 | -0.1838 | Yes | ||
| 37 | NCF4 | 610164 | 18001 | -2.534 | -0.1055 | Yes | ||
| 38 | GRHPR | 1240193 | 18542 | -4.350 | 0.0040 | Yes |