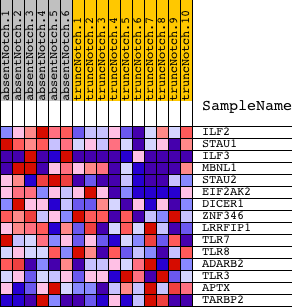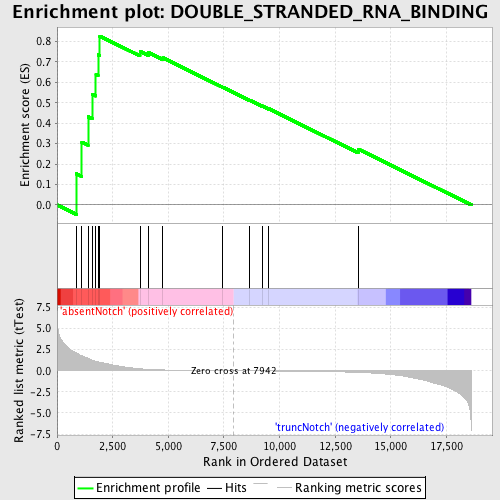
Profile of the Running ES Score & Positions of GeneSet Members on the Rank Ordered List
| Dataset | Set_03_absentNotch_versus_truncNotch.phenotype_absentNotch_versus_truncNotch.cls #absentNotch_versus_truncNotch.phenotype_absentNotch_versus_truncNotch.cls #absentNotch_versus_truncNotch_repos |
| Phenotype | phenotype_absentNotch_versus_truncNotch.cls#absentNotch_versus_truncNotch_repos |
| Upregulated in class | absentNotch |
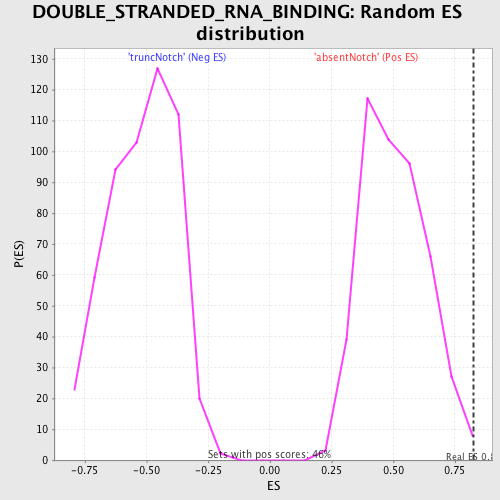
| GeneSet | DOUBLE_STRANDED_RNA_BINDING |
| Enrichment Score (ES) | 0.82579327 |
| Normalized Enrichment Score (NES) | 1.6360394 |
| Nominal p-value | 0.002173913 |
| FDR q-value | 0.33257776 |
| FWER p-Value | 0.856 |
| PROBE | DESCRIPTION (from dataset) | GENE SYMBOL | GENE_TITLE | RANK IN GENE LIST | RANK METRIC SCORE | RUNNING ES | CORE ENRICHMENT | |
|---|---|---|---|---|---|---|---|---|
| 1 | ILF2 | 2900253 | 868 | 2.089 | 0.1524 | Yes | ||
| 2 | STAU1 | 2320494 | 1112 | 1.767 | 0.3078 | Yes | ||
| 3 | ILF3 | 940722 3190647 6520110 | 1392 | 1.453 | 0.4314 | Yes | ||
| 4 | MBNL1 | 2640762 7100048 | 1576 | 1.263 | 0.5419 | Yes | ||
| 5 | STAU2 | 2810411 | 1746 | 1.117 | 0.6393 | Yes | ||
| 6 | EIF2AK2 | 870239 | 1841 | 1.053 | 0.7346 | Yes | ||
| 7 | DICER1 | 540286 | 1920 | 1.001 | 0.8258 | Yes | ||
| 8 | ZNF346 | 2650577 3990170 4150348 | 3726 | 0.232 | 0.7509 | No | ||
| 9 | LRRFIP1 | 870259 1050204 2760377 | 4107 | 0.160 | 0.7457 | No | ||
| 10 | TLR7 | 3140300 | 4758 | 0.092 | 0.7195 | No | ||
| 11 | TLR8 | 1240092 | 7433 | 0.009 | 0.5766 | No | ||
| 12 | ADARB2 | 2190170 | 8634 | -0.011 | 0.5132 | No | ||
| 13 | TLR3 | 6760451 | 9213 | -0.021 | 0.4841 | No | ||
| 14 | APTX | 3360041 4560167 | 9520 | -0.027 | 0.4703 | No | ||
| 15 | TARBP2 | 60369 380026 4760377 | 13533 | -0.196 | 0.2733 | No |