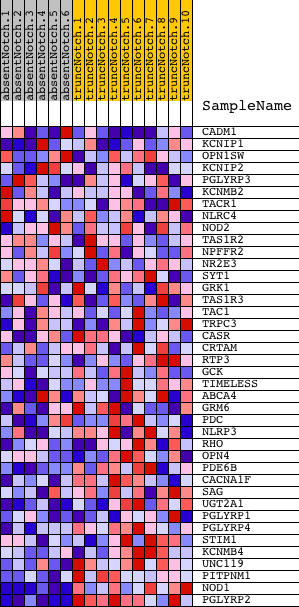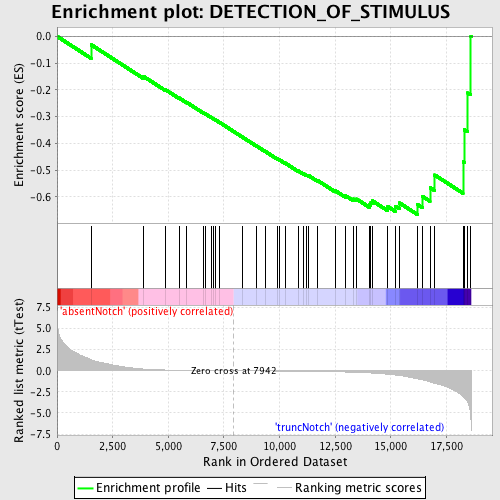
Profile of the Running ES Score & Positions of GeneSet Members on the Rank Ordered List
| Dataset | Set_03_absentNotch_versus_truncNotch.phenotype_absentNotch_versus_truncNotch.cls #absentNotch_versus_truncNotch.phenotype_absentNotch_versus_truncNotch.cls #absentNotch_versus_truncNotch_repos |
| Phenotype | phenotype_absentNotch_versus_truncNotch.cls#absentNotch_versus_truncNotch_repos |
| Upregulated in class | truncNotch |
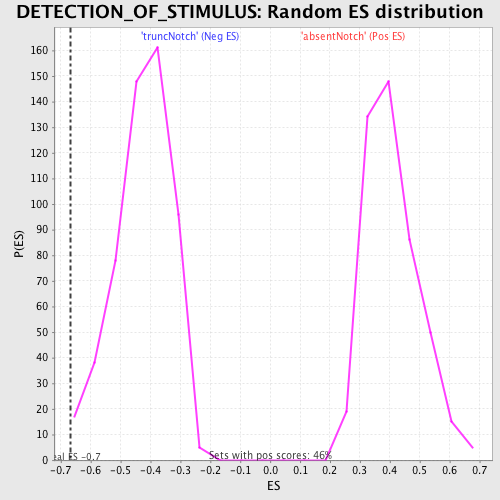
| GeneSet | DETECTION_OF_STIMULUS |
| Enrichment Score (ES) | -0.6664091 |
| Normalized Enrichment Score (NES) | -1.5698915 |
| Nominal p-value | 0.0018416207 |
| FDR q-value | 1.0 |
| FWER p-Value | 0.972 |
| PROBE | DESCRIPTION (from dataset) | GENE SYMBOL | GENE_TITLE | RANK IN GENE LIST | RANK METRIC SCORE | RUNNING ES | CORE ENRICHMENT | |
|---|---|---|---|---|---|---|---|---|
| 1 | CADM1 | 6620128 | 1531 | 1.306 | -0.0311 | No | ||
| 2 | KCNIP1 | 6370736 | 3879 | 0.202 | -0.1495 | No | ||
| 3 | OPN1SW | 6420377 | 4863 | 0.085 | -0.1991 | No | ||
| 4 | KCNIP2 | 60088 1780324 | 5484 | 0.055 | -0.2303 | No | ||
| 5 | PGLYRP3 | 6350403 | 5837 | 0.044 | -0.2476 | No | ||
| 6 | KCNMB2 | 3780128 4760136 | 6594 | 0.025 | -0.2873 | No | ||
| 7 | TACR1 | 70358 3840411 | 6659 | 0.024 | -0.2898 | No | ||
| 8 | NLRC4 | 5570332 | 6946 | 0.018 | -0.3045 | No | ||
| 9 | NOD2 | 2510050 | 7033 | 0.016 | -0.3085 | No | ||
| 10 | TAS1R2 | 4850072 | 7123 | 0.015 | -0.3127 | No | ||
| 11 | NPFFR2 | 2320273 | 7315 | 0.011 | -0.3226 | No | ||
| 12 | NR2E3 | 7050465 | 8347 | -0.007 | -0.3778 | No | ||
| 13 | SYT1 | 840364 | 8974 | -0.017 | -0.4108 | No | ||
| 14 | GRK1 | 1410112 | 9360 | -0.024 | -0.4306 | No | ||
| 15 | TAS1R3 | 360136 | 9884 | -0.034 | -0.4574 | No | ||
| 16 | TAC1 | 7000195 380706 | 9984 | -0.037 | -0.4613 | No | ||
| 17 | TRPC3 | 840064 | 10244 | -0.042 | -0.4736 | No | ||
| 18 | CASR | 610504 | 10835 | -0.055 | -0.5032 | No | ||
| 19 | CRTAM | 4480110 | 11064 | -0.060 | -0.5131 | No | ||
| 20 | RTP3 | 2260176 | 11215 | -0.065 | -0.5187 | No | ||
| 21 | GCK | 2370273 | 11320 | -0.069 | -0.5216 | No | ||
| 22 | TIMELESS | 3710315 | 11724 | -0.082 | -0.5401 | No | ||
| 23 | ABCA4 | 2370064 3940711 | 12509 | -0.118 | -0.5776 | No | ||
| 24 | GRM6 | 2030398 | 12967 | -0.149 | -0.5964 | No | ||
| 25 | PDC | 3140400 3780184 | 13317 | -0.174 | -0.6084 | No | ||
| 26 | NLRP3 | 1980064 4010180 | 13455 | -0.187 | -0.6084 | No | ||
| 27 | RHO | 4280398 | 14054 | -0.258 | -0.6304 | No | ||
| 28 | OPN4 | 5670091 | 14104 | -0.267 | -0.6226 | No | ||
| 29 | PDE6B | 2480187 | 14168 | -0.276 | -0.6152 | No | ||
| 30 | CACNA1F | 2360605 3390450 | 14865 | -0.404 | -0.6368 | Yes | ||
| 31 | SAG | 6550603 | 15195 | -0.498 | -0.6349 | Yes | ||
| 32 | UGT2A1 | 5080338 | 15388 | -0.564 | -0.6231 | Yes | ||
| 33 | PGLYRP1 | 6760242 | 16193 | -0.952 | -0.6290 | Yes | ||
| 34 | PGLYRP4 | 3780411 | 16432 | -1.084 | -0.5993 | Yes | ||
| 35 | STIM1 | 6380138 | 16762 | -1.311 | -0.5656 | Yes | ||
| 36 | KCNMB4 | 3290347 | 16973 | -1.485 | -0.5186 | Yes | ||
| 37 | UNC119 | 360372 | 18246 | -3.000 | -0.4693 | Yes | ||
| 38 | PITPNM1 | 4540528 | 18300 | -3.140 | -0.3490 | Yes | ||
| 39 | NOD1 | 2360368 | 18461 | -3.719 | -0.2116 | Yes | ||
| 40 | PGLYRP2 | 2340086 | 18598 | -5.603 | 0.0010 | Yes |