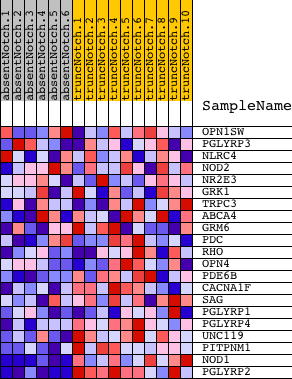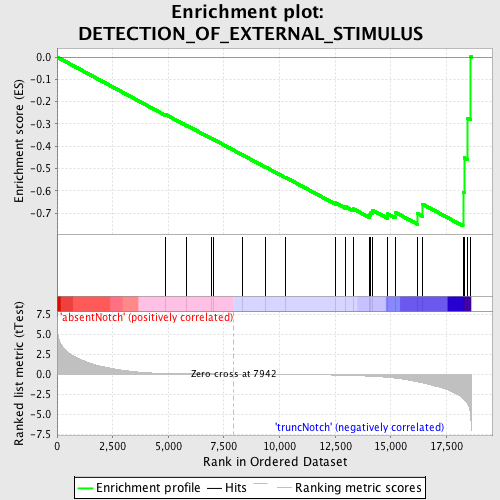
Profile of the Running ES Score & Positions of GeneSet Members on the Rank Ordered List
| Dataset | Set_03_absentNotch_versus_truncNotch.phenotype_absentNotch_versus_truncNotch.cls #absentNotch_versus_truncNotch.phenotype_absentNotch_versus_truncNotch.cls #absentNotch_versus_truncNotch_repos |
| Phenotype | phenotype_absentNotch_versus_truncNotch.cls#absentNotch_versus_truncNotch_repos |
| Upregulated in class | truncNotch |
| GeneSet | DETECTION_OF_EXTERNAL_STIMULUS |
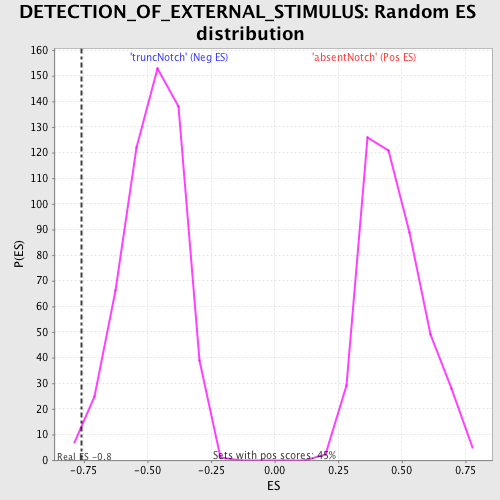
| Enrichment Score (ES) | -0.75812984 |
| Normalized Enrichment Score (NES) | -1.578909 |
| Nominal p-value | 0.010889292 |
| FDR q-value | 1.0 |
| FWER p-Value | 0.956 |
| PROBE | DESCRIPTION (from dataset) | GENE SYMBOL | GENE_TITLE | RANK IN GENE LIST | RANK METRIC SCORE | RUNNING ES | CORE ENRICHMENT | |
|---|---|---|---|---|---|---|---|---|
| 1 | OPN1SW | 6420377 | 4863 | 0.085 | -0.2572 | No | ||
| 2 | PGLYRP3 | 6350403 | 5837 | 0.044 | -0.3073 | No | ||
| 3 | NLRC4 | 5570332 | 6946 | 0.018 | -0.3660 | No | ||
| 4 | NOD2 | 2510050 | 7033 | 0.016 | -0.3699 | No | ||
| 5 | NR2E3 | 7050465 | 8347 | -0.007 | -0.4401 | No | ||
| 6 | GRK1 | 1410112 | 9360 | -0.024 | -0.4933 | No | ||
| 7 | TRPC3 | 840064 | 10244 | -0.042 | -0.5387 | No | ||
| 8 | ABCA4 | 2370064 3940711 | 12509 | -0.118 | -0.6545 | No | ||
| 9 | GRM6 | 2030398 | 12967 | -0.149 | -0.6716 | No | ||
| 10 | PDC | 3140400 3780184 | 13317 | -0.174 | -0.6816 | No | ||
| 11 | RHO | 4280398 | 14054 | -0.258 | -0.7082 | Yes | ||
| 12 | OPN4 | 5670091 | 14104 | -0.267 | -0.6974 | Yes | ||
| 13 | PDE6B | 2480187 | 14168 | -0.276 | -0.6869 | Yes | ||
| 14 | CACNA1F | 2360605 3390450 | 14865 | -0.404 | -0.7040 | Yes | ||
| 15 | SAG | 6550603 | 15195 | -0.498 | -0.6966 | Yes | ||
| 16 | PGLYRP1 | 6760242 | 16193 | -0.952 | -0.7024 | Yes | ||
| 17 | PGLYRP4 | 3780411 | 16432 | -1.084 | -0.6606 | Yes | ||
| 18 | UNC119 | 360372 | 18246 | -3.000 | -0.6072 | Yes | ||
| 19 | PITPNM1 | 4540528 | 18300 | -3.140 | -0.4521 | Yes | ||
| 20 | NOD1 | 2360368 | 18461 | -3.719 | -0.2736 | Yes | ||
| 21 | PGLYRP2 | 2340086 | 18598 | -5.603 | 0.0010 | Yes |