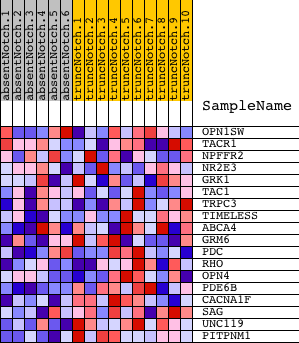
Profile of the Running ES Score & Positions of GeneSet Members on the Rank Ordered List
| Dataset | Set_03_absentNotch_versus_truncNotch.phenotype_absentNotch_versus_truncNotch.cls #absentNotch_versus_truncNotch.phenotype_absentNotch_versus_truncNotch.cls #absentNotch_versus_truncNotch_repos |
| Phenotype | phenotype_absentNotch_versus_truncNotch.cls#absentNotch_versus_truncNotch_repos |
| Upregulated in class | truncNotch |
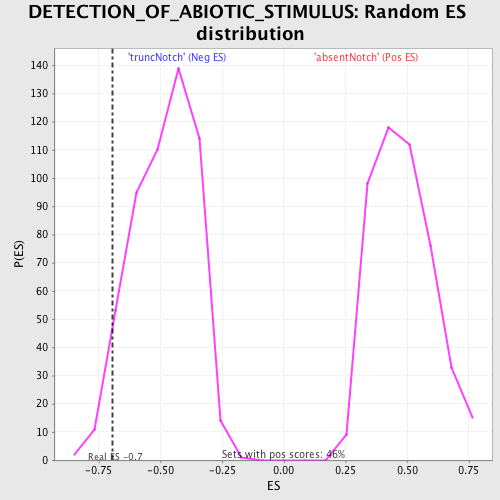
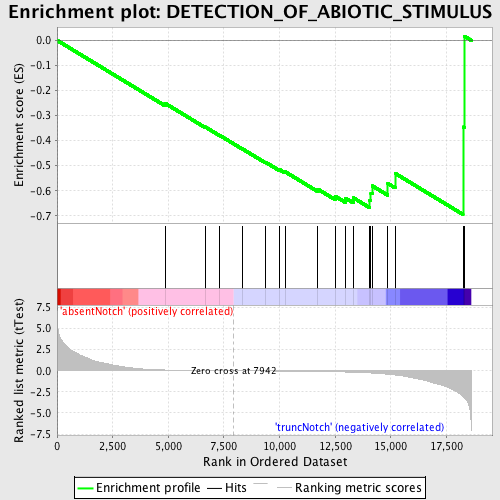
| GeneSet | DETECTION_OF_ABIOTIC_STIMULUS |
| Enrichment Score (ES) | -0.6945946 |
| Normalized Enrichment Score (NES) | -1.4322276 |
| Nominal p-value | 0.050092764 |
| FDR q-value | 1.0 |
| FWER p-Value | 1.0 |
| PROBE | DESCRIPTION (from dataset) | GENE SYMBOL | GENE_TITLE | RANK IN GENE LIST | RANK METRIC SCORE | RUNNING ES | CORE ENRICHMENT | |
|---|---|---|---|---|---|---|---|---|
| 1 | OPN1SW | 6420377 | 4863 | 0.085 | -0.2516 | No | ||
| 2 | TACR1 | 70358 3840411 | 6659 | 0.024 | -0.3454 | No | ||
| 3 | NPFFR2 | 2320273 | 7315 | 0.011 | -0.3794 | No | ||
| 4 | NR2E3 | 7050465 | 8347 | -0.007 | -0.4340 | No | ||
| 5 | GRK1 | 1410112 | 9360 | -0.024 | -0.4856 | No | ||
| 6 | TAC1 | 7000195 380706 | 9984 | -0.037 | -0.5149 | No | ||
| 7 | TRPC3 | 840064 | 10244 | -0.042 | -0.5239 | No | ||
| 8 | TIMELESS | 3710315 | 11724 | -0.082 | -0.5940 | No | ||
| 9 | ABCA4 | 2370064 3940711 | 12509 | -0.118 | -0.6224 | No | ||
| 10 | GRM6 | 2030398 | 12967 | -0.149 | -0.6297 | No | ||
| 11 | PDC | 3140400 3780184 | 13317 | -0.174 | -0.6281 | No | ||
| 12 | RHO | 4280398 | 14054 | -0.258 | -0.6376 | Yes | ||
| 13 | OPN4 | 5670091 | 14104 | -0.267 | -0.6092 | Yes | ||
| 14 | PDE6B | 2480187 | 14168 | -0.276 | -0.5805 | Yes | ||
| 15 | CACNA1F | 2360605 3390450 | 14865 | -0.404 | -0.5709 | Yes | ||
| 16 | SAG | 6550603 | 15195 | -0.498 | -0.5306 | Yes | ||
| 17 | UNC119 | 360372 | 18246 | -3.000 | -0.3455 | Yes | ||
| 18 | PITPNM1 | 4540528 | 18300 | -3.140 | 0.0170 | Yes |