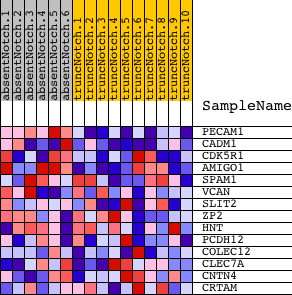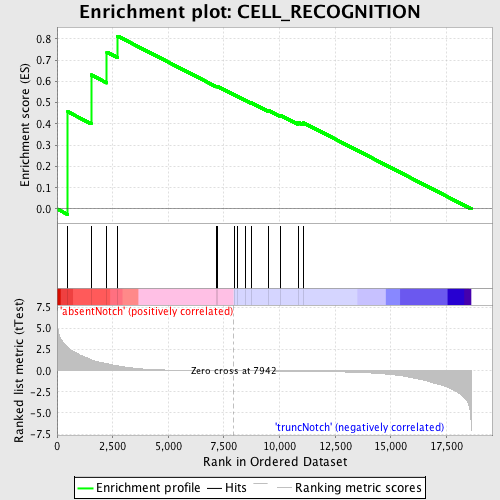
Profile of the Running ES Score & Positions of GeneSet Members on the Rank Ordered List
| Dataset | Set_03_absentNotch_versus_truncNotch.phenotype_absentNotch_versus_truncNotch.cls #absentNotch_versus_truncNotch.phenotype_absentNotch_versus_truncNotch.cls #absentNotch_versus_truncNotch_repos |
| Phenotype | phenotype_absentNotch_versus_truncNotch.cls#absentNotch_versus_truncNotch_repos |
| Upregulated in class | absentNotch |
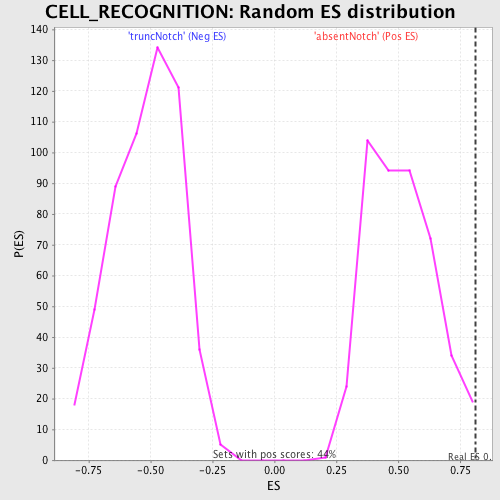
| GeneSet | CELL_RECOGNITION |
| Enrichment Score (ES) | 0.81324476 |
| Normalized Enrichment Score (NES) | 1.5928527 |
| Nominal p-value | 0.004524887 |
| FDR q-value | 0.546329 |
| FWER p-Value | 0.974 |
| PROBE | DESCRIPTION (from dataset) | GENE SYMBOL | GENE_TITLE | RANK IN GENE LIST | RANK METRIC SCORE | RUNNING ES | CORE ENRICHMENT | |
|---|---|---|---|---|---|---|---|---|
| 1 | PECAM1 | 4810139 | 482 | 2.745 | 0.4571 | Yes | ||
| 2 | CADM1 | 6620128 | 1531 | 1.306 | 0.6306 | Yes | ||
| 3 | CDK5R1 | 3870161 | 2238 | 0.826 | 0.7379 | Yes | ||
| 4 | AMIGO1 | 6180215 | 2720 | 0.575 | 0.8132 | Yes | ||
| 5 | SPAM1 | 4480398 | 7175 | 0.013 | 0.5762 | No | ||
| 6 | VCAN | 3290017 5910053 6940014 | 7194 | 0.013 | 0.5775 | No | ||
| 7 | SLIT2 | 1940037 | 7987 | -0.001 | 0.5351 | No | ||
| 8 | ZP2 | 1580408 | 8107 | -0.003 | 0.5291 | No | ||
| 9 | HNT | 6450731 | 8470 | -0.009 | 0.5112 | No | ||
| 10 | PCDH12 | 5340044 | 8722 | -0.013 | 0.5000 | No | ||
| 11 | COLEC12 | 2690717 4590086 | 9503 | -0.027 | 0.4627 | No | ||
| 12 | CLEC7A | 1990121 3450736 3800064 4610035 | 10049 | -0.038 | 0.4401 | No | ||
| 13 | CNTN4 | 1780300 5570577 6370019 | 10830 | -0.055 | 0.4079 | No | ||
| 14 | CRTAM | 4480110 | 11064 | -0.060 | 0.4060 | No |