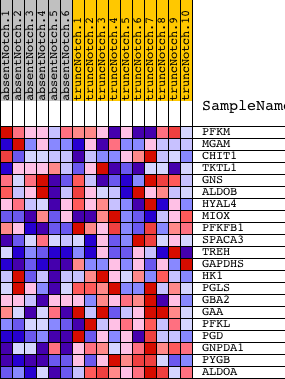
Profile of the Running ES Score & Positions of GeneSet Members on the Rank Ordered List
| Dataset | Set_03_absentNotch_versus_truncNotch.phenotype_absentNotch_versus_truncNotch.cls #absentNotch_versus_truncNotch.phenotype_absentNotch_versus_truncNotch.cls #absentNotch_versus_truncNotch_repos |
| Phenotype | phenotype_absentNotch_versus_truncNotch.cls#absentNotch_versus_truncNotch_repos |
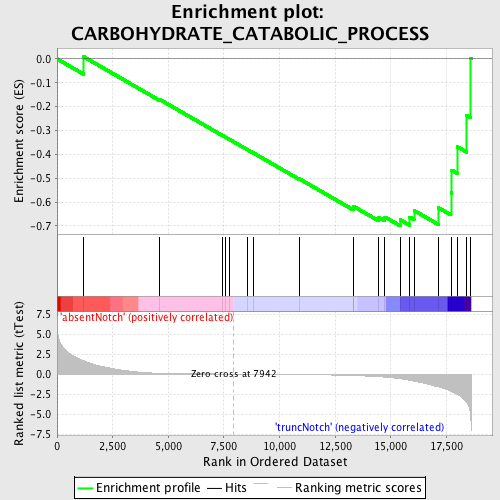
| Upregulated in class | truncNotch |
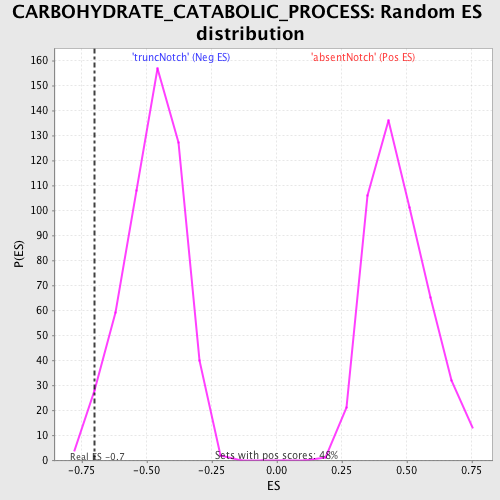
| GeneSet | CARBOHYDRATE_CATABOLIC_PROCESS |
| Enrichment Score (ES) | -0.70021605 |
| Normalized Enrichment Score (NES) | -1.4698973 |
| Nominal p-value | 0.026666667 |
| FDR q-value | 1.0 |
| FWER p-Value | 1.0 |
| PROBE | DESCRIPTION (from dataset) | GENE SYMBOL | GENE_TITLE | RANK IN GENE LIST | RANK METRIC SCORE | RUNNING ES | CORE ENRICHMENT | |
|---|---|---|---|---|---|---|---|---|
| 1 | PFKM | 1990156 5720168 | 1203 | 1.664 | 0.0088 | No | ||
| 2 | MGAM | 2510438 | 4586 | 0.106 | -0.1684 | No | ||
| 3 | CHIT1 | 7050347 | 7422 | 0.009 | -0.3205 | No | ||
| 4 | TKTL1 | 2810672 6760102 | 7565 | 0.006 | -0.3278 | No | ||
| 5 | GNS | 3120458 | 7751 | 0.003 | -0.3376 | No | ||
| 6 | ALDOB | 4730324 | 8557 | -0.010 | -0.3805 | No | ||
| 7 | HYAL4 | 1780020 | 8837 | -0.015 | -0.3948 | No | ||
| 8 | MIOX | 4810364 | 10881 | -0.056 | -0.5022 | No | ||
| 9 | PFKFB1 | 2370128 | 13313 | -0.174 | -0.6252 | No | ||
| 10 | SPACA3 | 1850161 | 13321 | -0.175 | -0.6179 | No | ||
| 11 | TREH | 630079 | 14456 | -0.324 | -0.6646 | No | ||
| 12 | GAPDHS | 2690463 | 14730 | -0.376 | -0.6626 | No | ||
| 13 | HK1 | 4280402 | 15430 | -0.580 | -0.6746 | Yes | ||
| 14 | PGLS | 2120324 | 15846 | -0.766 | -0.6631 | Yes | ||
| 15 | GBA2 | 2900372 | 16046 | -0.867 | -0.6354 | Yes | ||
| 16 | GAA | 520035 | 17146 | -1.593 | -0.6242 | Yes | ||
| 17 | PFKL | 6200167 | 17705 | -2.120 | -0.5605 | Yes | ||
| 18 | PGD | 6840048 | 17741 | -2.174 | -0.4664 | Yes | ||
| 19 | GNPDA1 | 580181 5220112 840731 | 17993 | -2.529 | -0.3682 | Yes | ||
| 20 | PYGB | 2510731 | 18413 | -3.499 | -0.2362 | Yes | ||
| 21 | ALDOA | 6290672 | 18596 | -5.593 | 0.0011 | Yes |