Profile of the Running ES Score & Positions of GeneSet Members on the Rank Ordered List
| Dataset | Set_03_absentNotch_versus_truncNotch.phenotype_absentNotch_versus_truncNotch.cls #absentNotch_versus_truncNotch.phenotype_absentNotch_versus_truncNotch.cls #absentNotch_versus_truncNotch_repos |
| Phenotype | phenotype_absentNotch_versus_truncNotch.cls#absentNotch_versus_truncNotch_repos |
| Upregulated in class | absentNotch |
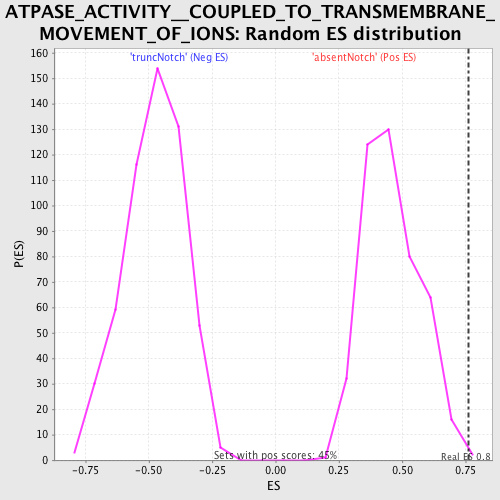
| GeneSet | ATPASE_ACTIVITY__COUPLED_TO_TRANSMEMBRANE_MOVEMENT_OF_IONS |
| Enrichment Score (ES) | 0.76384676 |
| Normalized Enrichment Score (NES) | 1.6626029 |
| Nominal p-value | 0.0022271716 |
| FDR q-value | 0.37086704 |
| FWER p-Value | 0.72 |
| PROBE | DESCRIPTION (from dataset) | GENE SYMBOL | GENE_TITLE | RANK IN GENE LIST | RANK METRIC SCORE | RUNNING ES | CORE ENRICHMENT | |
|---|---|---|---|---|---|---|---|---|
| 1 | ATP6V1C1 | 2690324 5220528 | 371 | 3.011 | 0.1588 | Yes | ||
| 2 | ATP1B1 | 3130594 | 478 | 2.762 | 0.3171 | Yes | ||
| 3 | ATP1B3 | 6040128 | 488 | 2.730 | 0.4787 | Yes | ||
| 4 | ATP2A2 | 1090075 3990279 | 939 | 1.987 | 0.5724 | Yes | ||
| 5 | ATP2A3 | 130440 2190451 | 1354 | 1.495 | 0.6389 | Yes | ||
| 6 | ATP6V1B2 | 4060528 | 1569 | 1.268 | 0.7027 | Yes | ||
| 7 | ATP1A1 | 5670451 | 1701 | 1.149 | 0.7638 | Yes | ||
| 8 | ATP6V0E1 | 6760053 | 3983 | 0.181 | 0.6519 | No | ||
| 9 | FXYD2 | 1400280 2350719 3520184 7040377 | 4330 | 0.131 | 0.6411 | No | ||
| 10 | ATP2B3 | 2260022 3780059 | 6082 | 0.037 | 0.5492 | No | ||
| 11 | ATP1B2 | 4480603 | 6814 | 0.020 | 0.5111 | No | ||
| 12 | ATP4A | 6220154 | 8116 | -0.003 | 0.4413 | No | ||
| 13 | ATP7A | 6550168 | 8843 | -0.015 | 0.4031 | No | ||
| 14 | ABCB11 | 7040170 | 11555 | -0.076 | 0.2618 | No | ||
| 15 | ATP1A2 | 110278 | 11868 | -0.087 | 0.2502 | No | ||
| 16 | ATP7B | 2060711 2470039 3140301 6650735 | 12464 | -0.116 | 0.2251 | No | ||
| 17 | ATP1A3 | 5690674 | 12986 | -0.150 | 0.2060 | No | ||
| 18 | ATP4B | 1740156 | 13399 | -0.181 | 0.1946 | No | ||
| 19 | ATP2C1 | 2630446 6520253 | 14495 | -0.331 | 0.1554 | No | ||
| 20 | ATP6V0C | 1780609 | 14530 | -0.337 | 0.1735 | No | ||
| 21 | ATP2A1 | 110309 | 15867 | -0.778 | 0.1478 | No |