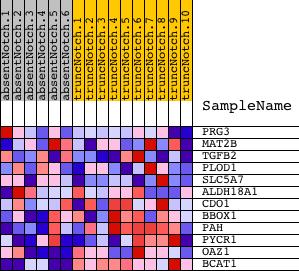
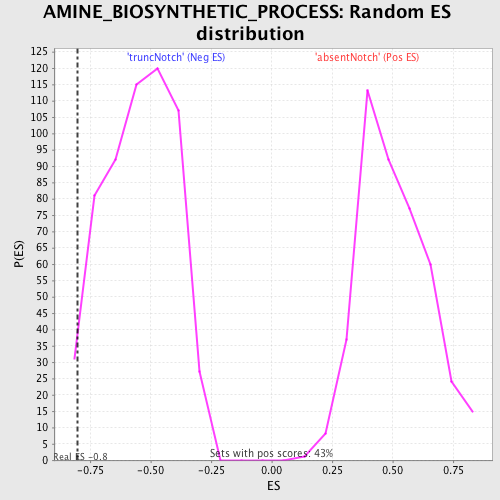
Profile of the Running ES Score & Positions of GeneSet Members on the Rank Ordered List
| Dataset | Set_03_absentNotch_versus_truncNotch.phenotype_absentNotch_versus_truncNotch.cls #absentNotch_versus_truncNotch.phenotype_absentNotch_versus_truncNotch.cls #absentNotch_versus_truncNotch_repos |
| Phenotype | phenotype_absentNotch_versus_truncNotch.cls#absentNotch_versus_truncNotch_repos |
| Upregulated in class | truncNotch |
| GeneSet | AMINE_BIOSYNTHETIC_PROCESS |
| Enrichment Score (ES) | -0.8006781 |
| Normalized Enrichment Score (NES) | -1.467479 |
| Nominal p-value | 0.029668411 |
| FDR q-value | 0.9996693 |
| FWER p-Value | 1.0 |
| PROBE | DESCRIPTION (from dataset) | GENE SYMBOL | GENE_TITLE | RANK IN GENE LIST | RANK METRIC SCORE | RUNNING ES | CORE ENRICHMENT | |
|---|---|---|---|---|---|---|---|---|
| 1 | PRG3 | 6220020 | 4477 | 0.115 | -0.2251 | No | ||
| 2 | MAT2B | 1690139 2510706 | 5295 | 0.063 | -0.2605 | No | ||
| 3 | TGFB2 | 4920292 | 6193 | 0.034 | -0.3041 | No | ||
| 4 | PLOD1 | 6040427 | 6398 | 0.029 | -0.3111 | No | ||
| 5 | SLC5A7 | 4760091 | 6902 | 0.018 | -0.3357 | No | ||
| 6 | ALDH18A1 | 2340601 | 7276 | 0.011 | -0.3542 | No | ||
| 7 | CDO1 | 2480279 | 8582 | -0.011 | -0.4229 | No | ||
| 8 | BBOX1 | 2030538 2370452 | 10153 | -0.040 | -0.5019 | No | ||
| 9 | PAH | 3800309 | 10587 | -0.050 | -0.5185 | No | ||
| 10 | PYCR1 | 6180670 | 15427 | -0.579 | -0.7004 | Yes | ||
| 11 | OAZ1 | 110181 | 17293 | -1.720 | -0.5684 | Yes | ||
| 12 | BCAT1 | 3290128 4050408 | 18570 | -4.735 | 0.0025 | Yes |