Profile of the Running ES Score & Positions of GeneSet Members on the Rank Ordered List
| Dataset | Set_03_absentNotch_versus_truncNotch.phenotype_absentNotch_versus_truncNotch.cls #absentNotch_versus_truncNotch.phenotype_absentNotch_versus_truncNotch.cls #absentNotch_versus_truncNotch_repos |
| Phenotype | phenotype_absentNotch_versus_truncNotch.cls#absentNotch_versus_truncNotch_repos |
| Upregulated in class | absentNotch |
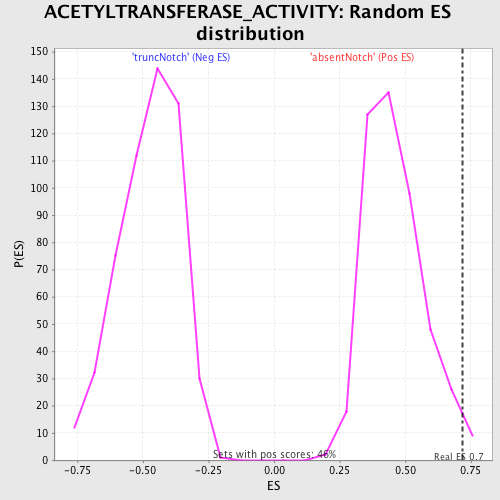
| GeneSet | ACETYLTRANSFERASE_ACTIVITY |
| Enrichment Score (ES) | 0.71668875 |
| Normalized Enrichment Score (NES) | 1.5576094 |
| Nominal p-value | 0.019438446 |
| FDR q-value | 0.6432038 |
| FWER p-Value | 0.997 |
| PROBE | DESCRIPTION (from dataset) | GENE SYMBOL | GENE_TITLE | RANK IN GENE LIST | RANK METRIC SCORE | RUNNING ES | CORE ENRICHMENT | |
|---|---|---|---|---|---|---|---|---|
| 1 | EDF1 | 1660035 2640161 | 10 | 6.032 | 0.2540 | Yes | ||
| 2 | HAT1 | 3710082 | 132 | 3.945 | 0.4139 | Yes | ||
| 3 | SMARCE1 | 4920465 4390398 | 335 | 3.093 | 0.5336 | Yes | ||
| 4 | CREBBP | 5690035 7040050 | 535 | 2.625 | 0.6336 | Yes | ||
| 5 | GTF3C4 | 1940750 4730114 | 1200 | 1.664 | 0.6681 | Yes | ||
| 6 | SAT1 | 4570463 | 2079 | 0.916 | 0.6596 | Yes | ||
| 7 | BRCA2 | 4280372 | 2264 | 0.810 | 0.6839 | Yes | ||
| 8 | NCOA3 | 4540195 | 2284 | 0.802 | 0.7167 | Yes | ||
| 9 | ACAT1 | 3170600 630438 | 5106 | 0.071 | 0.5680 | No | ||
| 10 | NAT2 | 6760195 | 5271 | 0.064 | 0.5619 | No | ||
| 11 | MYST4 | 1400563 2570687 3360458 6840402 | 5336 | 0.061 | 0.5610 | No | ||
| 12 | AANAT | 610609 | 9574 | -0.028 | 0.3344 | No | ||
| 13 | HADHA | 3190041 | 9974 | -0.036 | 0.3145 | No | ||
| 14 | ELP4 | 1230576 | 10132 | -0.040 | 0.3077 | No | ||
| 15 | NAT1 | 2480348 | 10488 | -0.047 | 0.2906 | No | ||
| 16 | MYST2 | 4540494 | 13030 | -0.153 | 0.1604 | No | ||
| 17 | TAF5 | 3450288 5890193 6860435 | 14025 | -0.254 | 0.1177 | No | ||
| 18 | NARG1 | 5910563 6350095 | 14518 | -0.334 | 0.1053 | No | ||
| 19 | MYST1 | 2190397 | 16420 | -1.076 | 0.0485 | No | ||
| 20 | MYST3 | 5270500 | 17220 | -1.648 | 0.0751 | No |