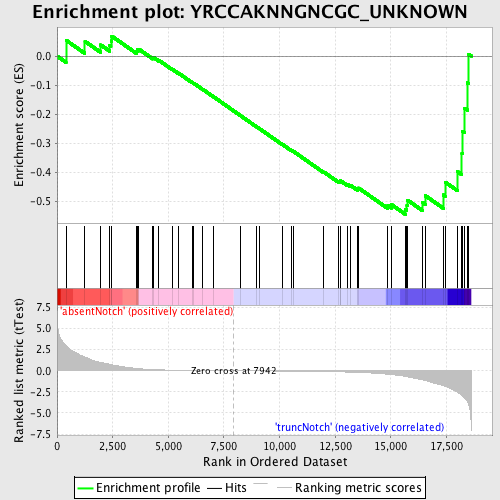
Profile of the Running ES Score & Positions of GeneSet Members on the Rank Ordered List
| Dataset | Set_03_absentNotch_versus_truncNotch.phenotype_absentNotch_versus_truncNotch.cls #absentNotch_versus_truncNotch.phenotype_absentNotch_versus_truncNotch.cls #absentNotch_versus_truncNotch_repos |
| Phenotype | phenotype_absentNotch_versus_truncNotch.cls#absentNotch_versus_truncNotch_repos |
| Upregulated in class | truncNotch |
| GeneSet | YRCCAKNNGNCGC_UNKNOWN |
| Enrichment Score (ES) | -0.54618907 |
| Normalized Enrichment Score (NES) | -1.3239433 |
| Nominal p-value | 0.07081174 |
| FDR q-value | 1.0 |
| FWER p-Value | 1.0 |
| PROBE | DESCRIPTION (from dataset) | GENE SYMBOL | GENE_TITLE | RANK IN GENE LIST | RANK METRIC SCORE | RUNNING ES | CORE ENRICHMENT | |
|---|---|---|---|---|---|---|---|---|
| 1 | SFRS6 | 60224 | 403 | 2.933 | 0.0548 | No | ||
| 2 | UBE2D3 | 3190452 | 1252 | 1.609 | 0.0511 | No | ||
| 3 | PSIP1 | 1780082 3190435 5050594 | 1961 | 0.985 | 0.0386 | No | ||
| 4 | FRS3 | 5890048 | 2365 | 0.759 | 0.0367 | No | ||
| 5 | DNAJC11 | 360465 3390215 | 2423 | 0.723 | 0.0525 | No | ||
| 6 | HHEX | 2340575 | 2457 | 0.703 | 0.0691 | No | ||
| 7 | GADD45B | 2350408 | 3576 | 0.272 | 0.0159 | No | ||
| 8 | CLDN1 | 5670746 | 3594 | 0.266 | 0.0220 | No | ||
| 9 | LHX2 | 3610463 | 3677 | 0.246 | 0.0240 | No | ||
| 10 | NR6A1 | 4010347 | 4308 | 0.134 | -0.0065 | No | ||
| 11 | CRBN | 2470070 3120427 3610044 6900452 | 4311 | 0.133 | -0.0031 | No | ||
| 12 | HR | 2690095 6200300 | 4578 | 0.106 | -0.0146 | No | ||
| 13 | HOXA2 | 2120121 | 5170 | 0.068 | -0.0447 | No | ||
| 14 | WNT1 | 4780148 | 5448 | 0.057 | -0.0581 | No | ||
| 15 | SYT6 | 2510280 3850128 4540064 | 6079 | 0.037 | -0.0911 | No | ||
| 16 | BHLHB5 | 6510520 | 6130 | 0.036 | -0.0928 | No | ||
| 17 | HCRTR1 | 1580273 | 6553 | 0.026 | -0.1149 | No | ||
| 18 | CDK5R2 | 3800110 | 7018 | 0.016 | -0.1395 | No | ||
| 19 | FBXO5 | 2630551 | 8235 | -0.005 | -0.2048 | No | ||
| 20 | TCERG1L | 3360707 | 8941 | -0.016 | -0.2424 | No | ||
| 21 | PTPRE | 1660286 2940095 | 9102 | -0.019 | -0.2505 | No | ||
| 22 | KAZALD1 | 380603 | 10129 | -0.040 | -0.3047 | No | ||
| 23 | HOXA6 | 2340333 | 10537 | -0.048 | -0.3253 | No | ||
| 24 | EIF2C1 | 6900551 | 10611 | -0.050 | -0.3280 | No | ||
| 25 | GRIN2A | 6550538 | 11986 | -0.092 | -0.3996 | No | ||
| 26 | KIF1B | 1240494 2370139 4570270 6510102 | 12650 | -0.126 | -0.4320 | No | ||
| 27 | DLL4 | 6400403 | 12715 | -0.130 | -0.4320 | No | ||
| 28 | FUCA1 | 610075 | 12722 | -0.131 | -0.4289 | No | ||
| 29 | GAD1 | 2360035 3140167 | 13037 | -0.153 | -0.4418 | No | ||
| 30 | BAI2 | 380632 630113 6650170 | 13183 | -0.165 | -0.4454 | No | ||
| 31 | GRIK3 | 6380592 | 13515 | -0.193 | -0.4582 | No | ||
| 32 | FZD5 | 4070452 | 13550 | -0.198 | -0.4548 | No | ||
| 33 | MAG | 2370037 | 14867 | -0.405 | -0.5151 | No | ||
| 34 | RAB3IP | 5550100 | 15037 | -0.450 | -0.5125 | No | ||
| 35 | CHN2 | 870528 | 15664 | -0.671 | -0.5287 | Yes | ||
| 36 | POU2F1 | 70577 430373 4850324 5910056 | 15724 | -0.694 | -0.5138 | Yes | ||
| 37 | CAMTA2 | 3990075 | 15753 | -0.710 | -0.4968 | Yes | ||
| 38 | PIGO | 1400528 2340026 5340097 | 16419 | -1.075 | -0.5046 | Yes | ||
| 39 | RBM16 | 6290286 6400181 | 16548 | -1.162 | -0.4812 | Yes | ||
| 40 | GNAS | 630441 1850373 4050152 | 17359 | -1.771 | -0.4786 | Yes | ||
| 41 | FLNA | 5390193 | 17445 | -1.860 | -0.4347 | Yes | ||
| 42 | DHCR24 | 840600 1050672 6290097 | 17997 | -2.532 | -0.3983 | Yes | ||
| 43 | GLTSCR2 | 1940463 | 18196 | -2.867 | -0.3342 | Yes | ||
| 44 | DUSP10 | 2850673 3360064 | 18230 | -2.963 | -0.2588 | Yes | ||
| 45 | PTPRF | 1770528 3190044 | 18319 | -3.211 | -0.1798 | Yes | ||
| 46 | ACBD4 | 6980079 | 18442 | -3.621 | -0.0920 | Yes | ||
| 47 | HES1 | 4810280 | 18487 | -3.885 | 0.0069 | Yes |

