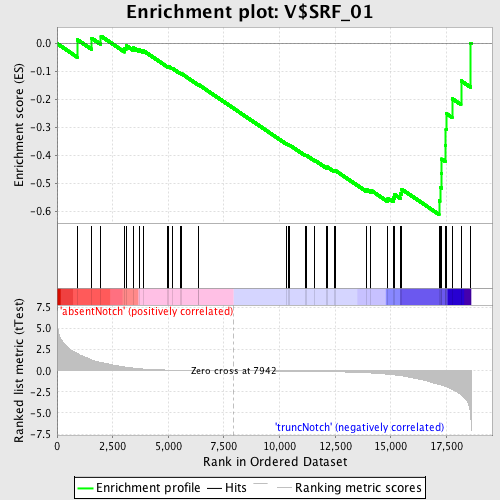
Profile of the Running ES Score & Positions of GeneSet Members on the Rank Ordered List
| Dataset | Set_03_absentNotch_versus_truncNotch.phenotype_absentNotch_versus_truncNotch.cls #absentNotch_versus_truncNotch.phenotype_absentNotch_versus_truncNotch.cls #absentNotch_versus_truncNotch_repos |
| Phenotype | phenotype_absentNotch_versus_truncNotch.cls#absentNotch_versus_truncNotch_repos |
| Upregulated in class | truncNotch |
| GeneSet | V$SRF_01 |
| Enrichment Score (ES) | -0.61074275 |
| Normalized Enrichment Score (NES) | -1.4652495 |
| Nominal p-value | 0.038043477 |
| FDR q-value | 0.7446185 |
| FWER p-Value | 0.957 |
| PROBE | DESCRIPTION (from dataset) | GENE SYMBOL | GENE_TITLE | RANK IN GENE LIST | RANK METRIC SCORE | RUNNING ES | CORE ENRICHMENT | |
|---|---|---|---|---|---|---|---|---|
| 1 | VCL | 4120487 | 901 | 2.044 | 0.0143 | No | ||
| 2 | HOXB4 | 540131 | 1545 | 1.296 | 0.0194 | No | ||
| 3 | SLC25A4 | 2360519 | 1971 | 0.981 | 0.0267 | No | ||
| 4 | EGR2 | 3800403 | 3028 | 0.452 | -0.0163 | No | ||
| 5 | SCOC | 610048 2230053 | 3099 | 0.427 | -0.0070 | No | ||
| 6 | WDR1 | 1090129 3990121 | 3427 | 0.318 | -0.0148 | No | ||
| 7 | EGR4 | 3120750 | 3703 | 0.239 | -0.0223 | No | ||
| 8 | PFN1 | 6130132 | 3881 | 0.201 | -0.0257 | No | ||
| 9 | TNMD | 3060520 | 4971 | 0.078 | -0.0819 | No | ||
| 10 | ITGB1BP2 | 6200129 | 5009 | 0.076 | -0.0815 | No | ||
| 11 | GPR20 | 6620601 | 5179 | 0.067 | -0.0886 | No | ||
| 12 | IL17B | 6940711 | 5528 | 0.054 | -0.1056 | No | ||
| 13 | ACTR3 | 1400497 | 5594 | 0.052 | -0.1076 | No | ||
| 14 | MYH11 | 7100273 | 6362 | 0.030 | -0.1479 | No | ||
| 15 | FOSB | 1940142 | 6364 | 0.030 | -0.1471 | No | ||
| 16 | FOSL1 | 430021 | 10317 | -0.043 | -0.3585 | No | ||
| 17 | DIXDC1 | 6980435 | 10381 | -0.045 | -0.3605 | No | ||
| 18 | KCNMB1 | 4760139 | 10456 | -0.047 | -0.3631 | No | ||
| 19 | TGFB1I1 | 2060288 6550450 | 11173 | -0.063 | -0.3997 | No | ||
| 20 | PHOX2B | 5270075 | 11195 | -0.064 | -0.3988 | No | ||
| 21 | CALD1 | 1770129 1940397 | 11583 | -0.077 | -0.4173 | No | ||
| 22 | CFL1 | 2340735 | 12117 | -0.097 | -0.4430 | No | ||
| 23 | THBS1 | 4560494 430288 | 12132 | -0.098 | -0.4408 | No | ||
| 24 | CA3 | 870687 5890390 | 12462 | -0.116 | -0.4549 | No | ||
| 25 | IER2 | 2030008 | 12496 | -0.117 | -0.4531 | No | ||
| 26 | FOS | 1850315 | 13888 | -0.238 | -0.5207 | No | ||
| 27 | TNNC1 | 1990575 | 14097 | -0.265 | -0.5237 | No | ||
| 28 | MRVI1 | 4810338 4850601 5900441 | 14869 | -0.405 | -0.5528 | No | ||
| 29 | PLCB3 | 4670402 | 15112 | -0.469 | -0.5514 | No | ||
| 30 | ACTG2 | 4780180 | 15160 | -0.485 | -0.5391 | No | ||
| 31 | EGR3 | 6940128 | 15440 | -0.582 | -0.5362 | No | ||
| 32 | CAP1 | 2650278 | 15489 | -0.600 | -0.5204 | No | ||
| 33 | MYL6 | 60563 6100152 | 17168 | -1.608 | -0.5614 | Yes | ||
| 34 | ASB2 | 4760168 | 17211 | -1.640 | -0.5133 | Yes | ||
| 35 | TAZ | 7100193 | 17274 | -1.703 | -0.4643 | Yes | ||
| 36 | TPM1 | 130673 | 17289 | -1.716 | -0.4124 | Yes | ||
| 37 | FLNA | 5390193 | 17445 | -1.860 | -0.3636 | Yes | ||
| 38 | JUNB | 4230048 | 17478 | -1.886 | -0.3074 | Yes | ||
| 39 | CNN2 | 2230433 5270446 | 17495 | -1.897 | -0.2500 | Yes | ||
| 40 | EGR1 | 4610347 | 17755 | -2.187 | -0.1968 | Yes | ||
| 41 | MUS81 | 6660184 | 18155 | -2.781 | -0.1329 | Yes | ||
| 42 | ANXA6 | 2190014 | 18586 | -5.135 | 0.0016 | Yes |

