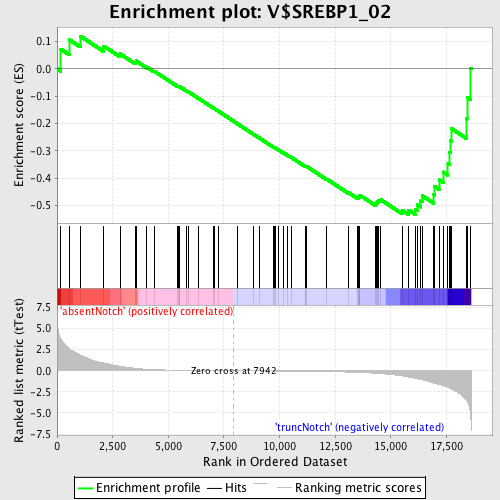
Profile of the Running ES Score & Positions of GeneSet Members on the Rank Ordered List
| Dataset | Set_03_absentNotch_versus_truncNotch.phenotype_absentNotch_versus_truncNotch.cls #absentNotch_versus_truncNotch.phenotype_absentNotch_versus_truncNotch.cls #absentNotch_versus_truncNotch_repos |
| Phenotype | phenotype_absentNotch_versus_truncNotch.cls#absentNotch_versus_truncNotch_repos |
| Upregulated in class | truncNotch |
| GeneSet | V$SREBP1_02 |
| Enrichment Score (ES) | -0.53354126 |
| Normalized Enrichment Score (NES) | -1.3533071 |
| Nominal p-value | 0.04317789 |
| FDR q-value | 1.0 |
| FWER p-Value | 1.0 |
| PROBE | DESCRIPTION (from dataset) | GENE SYMBOL | GENE_TITLE | RANK IN GENE LIST | RANK METRIC SCORE | RUNNING ES | CORE ENRICHMENT | |
|---|---|---|---|---|---|---|---|---|
| 1 | PTMA | 5570148 | 170 | 3.752 | 0.0721 | No | ||
| 2 | MORF4L2 | 6450133 | 566 | 2.548 | 0.1060 | No | ||
| 3 | ELOVL5 | 3800170 | 1046 | 1.836 | 0.1200 | No | ||
| 4 | YWHAE | 5310435 | 2086 | 0.911 | 0.0837 | No | ||
| 5 | DLGAP4 | 4570672 5690161 | 2827 | 0.529 | 0.0553 | No | ||
| 6 | ZFP36L1 | 2510138 4120048 | 3513 | 0.292 | 0.0247 | No | ||
| 7 | ZFYVE1 | 60440 | 3545 | 0.281 | 0.0292 | No | ||
| 8 | KTN1 | 70446 3450609 4560048 | 4035 | 0.171 | 0.0065 | No | ||
| 9 | HYAL1 | 3850341 | 4368 | 0.127 | -0.0086 | No | ||
| 10 | NOTCH2 | 2570397 | 5411 | 0.058 | -0.0635 | No | ||
| 11 | PACSIN3 | 4540369 4540400 5360037 6940129 | 5445 | 0.057 | -0.0641 | No | ||
| 12 | BAI3 | 940692 | 5498 | 0.055 | -0.0657 | No | ||
| 13 | TOM1L1 | 4920056 3190070 | 5508 | 0.055 | -0.0650 | No | ||
| 14 | MEF2C | 670025 780338 | 5821 | 0.044 | -0.0808 | No | ||
| 15 | POU4F2 | 2120195 2570022 | 5886 | 0.042 | -0.0834 | No | ||
| 16 | RBP3 | 1400059 | 6346 | 0.030 | -0.1074 | No | ||
| 17 | HS6ST2 | 520133 5550603 | 7046 | 0.016 | -0.1448 | No | ||
| 18 | UBE2B | 4780497 | 7057 | 0.016 | -0.1450 | No | ||
| 19 | CPA4 | 3610100 | 7259 | 0.012 | -0.1555 | No | ||
| 20 | RARA | 4050161 | 8125 | -0.003 | -0.2021 | No | ||
| 21 | ATP2B2 | 3780397 | 8815 | -0.015 | -0.2389 | No | ||
| 22 | NF1 | 6980433 | 9084 | -0.019 | -0.2529 | No | ||
| 23 | SSTR3 | 5420064 | 9726 | -0.031 | -0.2868 | No | ||
| 24 | NTN4 | 6940398 | 9751 | -0.031 | -0.2874 | No | ||
| 25 | PLA2G3 | 5130739 | 9804 | -0.033 | -0.2895 | No | ||
| 26 | GFAP | 2060092 | 9930 | -0.035 | -0.2955 | No | ||
| 27 | GREM1 | 3940180 | 10175 | -0.041 | -0.3077 | No | ||
| 28 | BCL6B | 60047 | 10365 | -0.044 | -0.3170 | No | ||
| 29 | SEZ6 | 3450722 | 10540 | -0.049 | -0.3253 | No | ||
| 30 | DHRS3 | 360609 | 11160 | -0.063 | -0.3573 | No | ||
| 31 | FGF12 | 1740446 2360037 | 11185 | -0.064 | -0.3572 | No | ||
| 32 | PHOX2B | 5270075 | 11195 | -0.064 | -0.3563 | No | ||
| 33 | CHRM3 | 6110725 | 12112 | -0.097 | -0.4035 | No | ||
| 34 | CD2AP | 1940369 | 13118 | -0.159 | -0.4543 | No | ||
| 35 | PLAG1 | 1450142 3870139 6520039 | 13519 | -0.194 | -0.4716 | No | ||
| 36 | NOL4 | 5050446 5360519 | 13567 | -0.201 | -0.4698 | No | ||
| 37 | WDR13 | 3840520 4670064 | 13572 | -0.202 | -0.4656 | No | ||
| 38 | HOXB8 | 3710450 | 13594 | -0.205 | -0.4623 | No | ||
| 39 | NRGN | 4280433 | 14300 | -0.297 | -0.4939 | No | ||
| 40 | SREBF2 | 3390692 | 14344 | -0.305 | -0.4896 | No | ||
| 41 | FOXP2 | 3520561 4150372 4760524 | 14381 | -0.312 | -0.4848 | No | ||
| 42 | INPP4A | 510215 1090541 4850093 6100519 | 14445 | -0.323 | -0.4812 | No | ||
| 43 | KIF1C | 2480484 | 14556 | -0.341 | -0.4797 | No | ||
| 44 | DDR1 | 2060044 5220180 | 15514 | -0.607 | -0.5181 | Yes | ||
| 45 | CEBPB | 2970019 | 15798 | -0.738 | -0.5174 | Yes | ||
| 46 | GNB2 | 2350053 | 16099 | -0.898 | -0.5141 | Yes | ||
| 47 | BAZ2A | 730184 | 16198 | -0.958 | -0.4986 | Yes | ||
| 48 | NDRG2 | 450403 | 16341 | -1.032 | -0.4839 | Yes | ||
| 49 | SPI1 | 1410397 | 16408 | -1.071 | -0.4643 | Yes | ||
| 50 | LOXL1 | 3520537 | 16936 | -1.463 | -0.4610 | Yes | ||
| 51 | CACNA2D3 | 4010184 | 16974 | -1.486 | -0.4308 | Yes | ||
| 52 | RAB33A | 6590195 | 17187 | -1.624 | -0.4070 | Yes | ||
| 53 | GNAS | 630441 1850373 4050152 | 17359 | -1.771 | -0.3779 | Yes | ||
| 54 | DPYSL2 | 2100427 3130112 5700324 | 17569 | -1.966 | -0.3465 | Yes | ||
| 55 | HOXB1 | 2120110 | 17645 | -2.050 | -0.3062 | Yes | ||
| 56 | FBS1 | 2570520 | 17674 | -2.080 | -0.2626 | Yes | ||
| 57 | EIF5A | 1500059 5290022 6370026 | 17720 | -2.143 | -0.2186 | Yes | ||
| 58 | POU2AF1 | 5690242 | 18386 | -3.410 | -0.1806 | Yes | ||
| 59 | CORO1A | 3140609 3190020 3190037 | 18446 | -3.635 | -0.1050 | Yes | ||
| 60 | RHOG | 6760575 | 18589 | -5.267 | 0.0015 | Yes |

