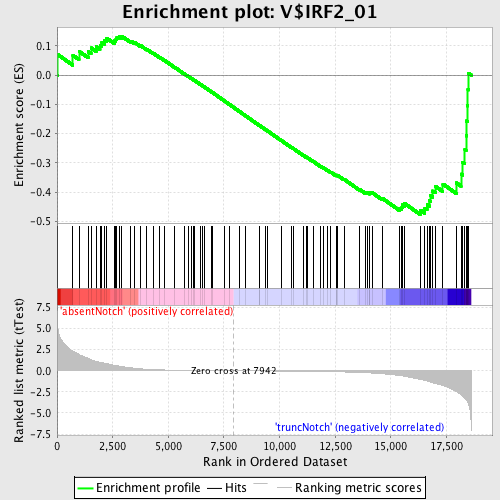
Profile of the Running ES Score & Positions of GeneSet Members on the Rank Ordered List
| Dataset | Set_03_absentNotch_versus_truncNotch.phenotype_absentNotch_versus_truncNotch.cls #absentNotch_versus_truncNotch.phenotype_absentNotch_versus_truncNotch.cls #absentNotch_versus_truncNotch_repos |
| Phenotype | phenotype_absentNotch_versus_truncNotch.cls#absentNotch_versus_truncNotch_repos |
| Upregulated in class | truncNotch |
| GeneSet | V$IRF2_01 |
| Enrichment Score (ES) | -0.4768711 |
| Normalized Enrichment Score (NES) | -1.2642804 |
| Nominal p-value | 0.08188153 |
| FDR q-value | 0.9915733 |
| FWER p-Value | 1.0 |
| PROBE | DESCRIPTION (from dataset) | GENE SYMBOL | GENE_TITLE | RANK IN GENE LIST | RANK METRIC SCORE | RUNNING ES | CORE ENRICHMENT | |
|---|---|---|---|---|---|---|---|---|
| 1 | MAPK6 | 6760520 | 38 | 4.847 | 0.0701 | No | ||
| 2 | USP18 | 4010110 | 710 | 2.303 | 0.0682 | No | ||
| 3 | UPF2 | 4810471 | 985 | 1.906 | 0.0817 | No | ||
| 4 | ROCK1 | 130044 | 1410 | 1.431 | 0.0802 | No | ||
| 5 | NT5C3 | 1570075 | 1528 | 1.312 | 0.0934 | No | ||
| 6 | VGLL4 | 6860463 | 1755 | 1.106 | 0.0976 | No | ||
| 7 | B2M | 5080332 5130059 | 1928 | 1.000 | 0.1032 | No | ||
| 8 | EIF4A2 | 1170494 1740711 2850504 | 2011 | 0.958 | 0.1131 | No | ||
| 9 | BBX | 6520112 | 2137 | 0.886 | 0.1195 | No | ||
| 10 | DDX58 | 2450075 | 2231 | 0.831 | 0.1269 | No | ||
| 11 | LDB2 | 5670441 6110170 | 2584 | 0.642 | 0.1174 | No | ||
| 12 | DLX1 | 360168 | 2642 | 0.614 | 0.1235 | No | ||
| 13 | ARHGEF6 | 4780164 6380450 | 2687 | 0.589 | 0.1299 | No | ||
| 14 | BST2 | 6760487 | 2799 | 0.541 | 0.1320 | No | ||
| 15 | CSAD | 770215 | 2904 | 0.497 | 0.1337 | No | ||
| 16 | E2F3 | 50162 460180 | 3320 | 0.350 | 0.1166 | No | ||
| 17 | SLC38A2 | 1470242 3800026 | 3463 | 0.306 | 0.1135 | No | ||
| 18 | CDK6 | 4920253 | 3755 | 0.226 | 0.1011 | No | ||
| 19 | TERF2IP | 580010 870364 2190358 | 4032 | 0.172 | 0.0888 | No | ||
| 20 | THRAP1 | 2470121 | 4332 | 0.131 | 0.0746 | No | ||
| 21 | ATF3 | 1940546 | 4592 | 0.105 | 0.0622 | No | ||
| 22 | NR3C2 | 2480324 6400093 | 4845 | 0.086 | 0.0499 | No | ||
| 23 | ESR1 | 4060372 5860193 | 5289 | 0.063 | 0.0269 | No | ||
| 24 | HPCAL1 | 1980129 2350348 | 5707 | 0.048 | 0.0051 | No | ||
| 25 | UBD | 5570632 | 5885 | 0.043 | -0.0038 | No | ||
| 26 | ARHGAP5 | 2510619 3360035 | 6037 | 0.038 | -0.0114 | No | ||
| 27 | BHLHB5 | 6510520 | 6130 | 0.036 | -0.0158 | No | ||
| 28 | BNC2 | 4810603 | 6167 | 0.035 | -0.0172 | No | ||
| 29 | PRDM16 | 4120541 | 6425 | 0.029 | -0.0307 | No | ||
| 30 | MITF | 380056 | 6523 | 0.026 | -0.0355 | No | ||
| 31 | PLXNC1 | 5860315 | 6634 | 0.024 | -0.0411 | No | ||
| 32 | TGFB3 | 1070041 | 6952 | 0.017 | -0.0579 | No | ||
| 33 | PGM5 | 2340446 | 6980 | 0.017 | -0.0591 | No | ||
| 34 | NPR3 | 1580239 | 7514 | 0.007 | -0.0878 | No | ||
| 35 | IL11 | 1740398 | 7736 | 0.003 | -0.0996 | No | ||
| 36 | OTX1 | 2510215 | 8204 | -0.004 | -0.1248 | No | ||
| 37 | TMPRSS5 | 4060068 | 8465 | -0.009 | -0.1387 | No | ||
| 38 | PSMA3 | 5900047 7040161 | 9078 | -0.019 | -0.1714 | No | ||
| 39 | CXCL10 | 2450408 | 9092 | -0.019 | -0.1718 | No | ||
| 40 | ASPA | 3290400 | 9386 | -0.024 | -0.1873 | No | ||
| 41 | IFNB1 | 1400142 | 9444 | -0.025 | -0.1900 | No | ||
| 42 | IL27 | 1990324 | 10075 | -0.039 | -0.2234 | No | ||
| 43 | HOXA6 | 2340333 | 10537 | -0.048 | -0.2476 | No | ||
| 44 | MSX1 | 2650309 | 10625 | -0.050 | -0.2515 | No | ||
| 45 | TNFSF13B | 1940438 6510441 | 11088 | -0.061 | -0.2755 | No | ||
| 46 | RIMS2 | 670725 | 11187 | -0.064 | -0.2799 | No | ||
| 47 | RFX4 | 3710100 5340215 | 11234 | -0.065 | -0.2814 | No | ||
| 48 | GLRA1 | 610575 | 11505 | -0.074 | -0.2948 | No | ||
| 49 | TBX1 | 3710133 6590121 | 11835 | -0.086 | -0.3113 | No | ||
| 50 | PDGFC | 4200133 | 11968 | -0.091 | -0.3171 | No | ||
| 51 | EGFL6 | 3940181 | 12150 | -0.099 | -0.3254 | No | ||
| 52 | DLX4 | 50215 6650059 | 12309 | -0.107 | -0.3323 | No | ||
| 53 | MCM8 | 6130743 | 12548 | -0.120 | -0.3433 | No | ||
| 54 | USF1 | 4280156 4610114 6370113 | 12551 | -0.121 | -0.3417 | No | ||
| 55 | LIF | 1410373 2060129 3990338 | 12589 | -0.122 | -0.3418 | No | ||
| 56 | REL | 360707 | 12900 | -0.143 | -0.3564 | No | ||
| 57 | PROX1 | 4210193 | 13600 | -0.205 | -0.3911 | No | ||
| 58 | ASH1L | 2510402 5360687 6650685 | 13874 | -0.236 | -0.4023 | No | ||
| 59 | TRPM3 | 2470110 6400731 6550047 | 13949 | -0.245 | -0.4027 | No | ||
| 60 | KCNE4 | 2470102 | 14029 | -0.255 | -0.4031 | No | ||
| 61 | NDN | 5670075 | 14061 | -0.260 | -0.4009 | No | ||
| 62 | CUL2 | 4200278 | 14153 | -0.274 | -0.4017 | No | ||
| 63 | BCL11A | 6860369 | 14617 | -0.352 | -0.4215 | No | ||
| 64 | DAP3 | 1660528 2120039 5420593 | 15407 | -0.571 | -0.4556 | No | ||
| 65 | DLG1 | 2630091 6020286 | 15497 | -0.602 | -0.4514 | No | ||
| 66 | KARS | 6520575 | 15526 | -0.611 | -0.4438 | No | ||
| 67 | DNASE1L3 | 670086 | 15623 | -0.650 | -0.4393 | No | ||
| 68 | PSME1 | 450193 4480035 | 16320 | -1.022 | -0.4617 | Yes | ||
| 69 | FXYD5 | 4060301 6590400 | 16529 | -1.149 | -0.4558 | Yes | ||
| 70 | IL15RA | 2570270 3190711 6100091 6100270 | 16631 | -1.218 | -0.4431 | Yes | ||
| 71 | MAP3K11 | 7000039 | 16729 | -1.287 | -0.4292 | Yes | ||
| 72 | PRDX5 | 1660592 2030091 | 16787 | -1.328 | -0.4125 | Yes | ||
| 73 | BAT5 | 5720687 | 16882 | -1.422 | -0.3964 | Yes | ||
| 74 | SIPA1 | 5220687 | 17003 | -1.500 | -0.3806 | Yes | ||
| 75 | PIGR | 6520441 | 17342 | -1.759 | -0.3726 | Yes | ||
| 76 | BLK | 1940128 5390053 | 17951 | -2.469 | -0.3687 | Yes | ||
| 77 | PSMB8 | 2850707 | 18157 | -2.786 | -0.3383 | Yes | ||
| 78 | DUSP10 | 2850673 3360064 | 18230 | -2.963 | -0.2981 | Yes | ||
| 79 | GSDMDC1 | 4010092 5050091 | 18330 | -3.240 | -0.2552 | Yes | ||
| 80 | TAPBP | 1980110 | 18385 | -3.409 | -0.2073 | Yes | ||
| 81 | PSMB9 | 6980471 | 18404 | -3.473 | -0.1566 | Yes | ||
| 82 | TAP1 | 4050047 | 18449 | -3.645 | -0.1048 | Yes | ||
| 83 | USP5 | 4850017 | 18465 | -3.756 | -0.0497 | Yes | ||
| 84 | TCIRG1 | 4590524 5910079 6900619 | 18486 | -3.880 | 0.0070 | Yes |

