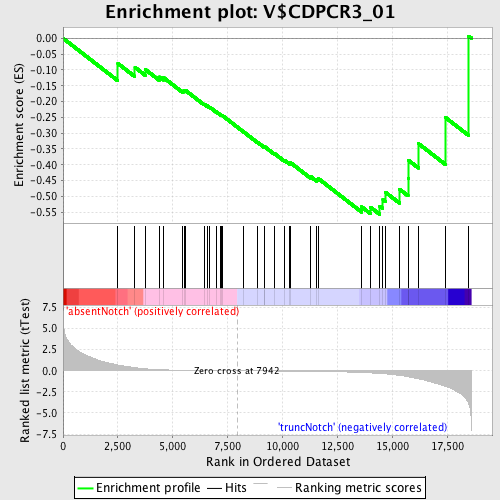
Profile of the Running ES Score & Positions of GeneSet Members on the Rank Ordered List
| Dataset | Set_03_absentNotch_versus_truncNotch.phenotype_absentNotch_versus_truncNotch.cls #absentNotch_versus_truncNotch.phenotype_absentNotch_versus_truncNotch.cls #absentNotch_versus_truncNotch_repos |
| Phenotype | phenotype_absentNotch_versus_truncNotch.cls#absentNotch_versus_truncNotch_repos |
| Upregulated in class | truncNotch |
| GeneSet | V$CDPCR3_01 |
| Enrichment Score (ES) | -0.55711734 |
| Normalized Enrichment Score (NES) | -1.3278902 |
| Nominal p-value | 0.08288288 |
| FDR q-value | 1.0 |
| FWER p-Value | 1.0 |
| PROBE | DESCRIPTION (from dataset) | GENE SYMBOL | GENE_TITLE | RANK IN GENE LIST | RANK METRIC SCORE | RUNNING ES | CORE ENRICHMENT | |
|---|---|---|---|---|---|---|---|---|
| 1 | CDK2AP1 | 2340156 | 2497 | 0.677 | -0.0796 | No | ||
| 2 | SP6 | 60484 510452 2690333 | 3275 | 0.366 | -0.0918 | No | ||
| 3 | PPARG | 1990168 2680603 6130632 | 3741 | 0.230 | -0.0983 | No | ||
| 4 | CER1 | 840102 | 4377 | 0.126 | -0.1223 | No | ||
| 5 | MARK1 | 450484 | 4561 | 0.108 | -0.1234 | No | ||
| 6 | UPP2 | 2190091 2680746 6940647 | 5449 | 0.057 | -0.1666 | No | ||
| 7 | PAK3 | 4210136 | 5510 | 0.055 | -0.1654 | No | ||
| 8 | SIX1 | 6760471 | 5576 | 0.052 | -0.1646 | No | ||
| 9 | CNTN6 | 2630711 | 6432 | 0.029 | -0.2083 | No | ||
| 10 | SPP2 | 3840253 | 6567 | 0.026 | -0.2135 | No | ||
| 11 | PIP5K1A | 4560672 | 6690 | 0.023 | -0.2182 | No | ||
| 12 | FGF7 | 5390484 | 6979 | 0.017 | -0.2323 | No | ||
| 13 | CRH | 3710301 | 7181 | 0.013 | -0.2421 | No | ||
| 14 | HOXA4 | 940152 | 7228 | 0.012 | -0.2436 | No | ||
| 15 | ZIC4 | 1500082 | 7250 | 0.012 | -0.2437 | No | ||
| 16 | LPHN2 | 4480010 | 8229 | -0.005 | -0.2960 | No | ||
| 17 | MYT1 | 6770524 | 8862 | -0.015 | -0.3288 | No | ||
| 18 | SIX3 | 3830402 | 9182 | -0.021 | -0.3443 | No | ||
| 19 | NPAS1 | 5570020 | 9184 | -0.021 | -0.3426 | No | ||
| 20 | NFIA | 2760129 5860278 | 9656 | -0.030 | -0.3656 | No | ||
| 21 | BHLHB3 | 3450438 | 10111 | -0.039 | -0.3869 | No | ||
| 22 | NTN1 | 5700600 | 10333 | -0.044 | -0.3952 | No | ||
| 23 | BMP4 | 380113 | 10348 | -0.044 | -0.3924 | No | ||
| 24 | ZIC1 | 670113 | 11283 | -0.067 | -0.4373 | No | ||
| 25 | ETV3 | 5360487 | 11554 | -0.076 | -0.4457 | No | ||
| 26 | FGF10 | 730458 840706 | 11639 | -0.079 | -0.4438 | No | ||
| 27 | CSMD3 | 1660427 1940687 | 13606 | -0.206 | -0.5330 | No | ||
| 28 | IRAK1 | 4120593 | 14010 | -0.252 | -0.5342 | Yes | ||
| 29 | PTGFRN | 4120524 | 14436 | -0.321 | -0.5311 | Yes | ||
| 30 | DLX5 | 5130519 6040021 | 14576 | -0.345 | -0.5107 | Yes | ||
| 31 | TCF1 | 5390022 | 14697 | -0.371 | -0.4872 | Yes | ||
| 32 | FOXB1 | 4920270 5290463 | 15331 | -0.543 | -0.4773 | Yes | ||
| 33 | POU2F1 | 70577 430373 4850324 5910056 | 15724 | -0.694 | -0.4422 | Yes | ||
| 34 | POU3F4 | 870274 | 15748 | -0.707 | -0.3862 | Yes | ||
| 35 | L3MBTL2 | 6020341 | 16197 | -0.956 | -0.3330 | Yes | ||
| 36 | RBPMS | 3990494 | 17423 | -1.837 | -0.2502 | Yes | ||
| 37 | HES1 | 4810280 | 18487 | -3.885 | 0.0069 | Yes |

