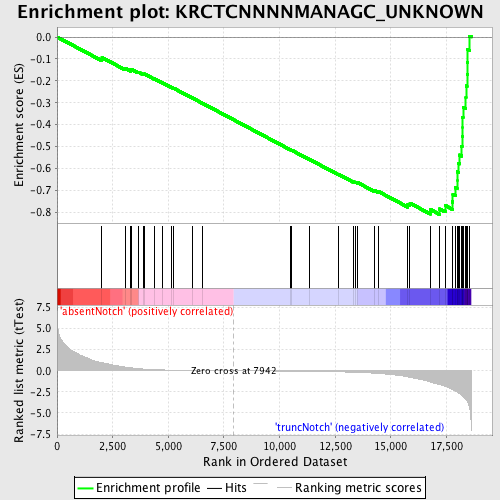
Profile of the Running ES Score & Positions of GeneSet Members on the Rank Ordered List
| Dataset | Set_03_absentNotch_versus_truncNotch.phenotype_absentNotch_versus_truncNotch.cls #absentNotch_versus_truncNotch.phenotype_absentNotch_versus_truncNotch.cls #absentNotch_versus_truncNotch_repos |
| Phenotype | phenotype_absentNotch_versus_truncNotch.cls#absentNotch_versus_truncNotch_repos |
| Upregulated in class | truncNotch |
| GeneSet | KRCTCNNNNMANAGC_UNKNOWN |
| Enrichment Score (ES) | -0.8099946 |
| Normalized Enrichment Score (NES) | -1.9694196 |
| Nominal p-value | 0.0 |
| FDR q-value | 0.0 |
| FWER p-Value | 0.0 |
| PROBE | DESCRIPTION (from dataset) | GENE SYMBOL | GENE_TITLE | RANK IN GENE LIST | RANK METRIC SCORE | RUNNING ES | CORE ENRICHMENT | |
|---|---|---|---|---|---|---|---|---|
| 1 | HIST1H1C | 3870603 | 2016 | 0.956 | -0.0938 | No | ||
| 2 | HIST1H2AE | 4920672 | 3064 | 0.436 | -0.1434 | No | ||
| 3 | HIST1H2AC | 3130292 | 3314 | 0.352 | -0.1514 | No | ||
| 4 | HIST1H2AH | 3710333 | 3331 | 0.348 | -0.1469 | No | ||
| 5 | HIST1H2BC | 2570156 6520315 | 3645 | 0.253 | -0.1598 | No | ||
| 6 | HIST2H2AC | 2030600 | 3892 | 0.199 | -0.1700 | No | ||
| 7 | DSCAM | 1780050 2450731 2810438 | 3921 | 0.193 | -0.1685 | No | ||
| 8 | HIST1H2BE | 6550053 | 4362 | 0.128 | -0.1902 | No | ||
| 9 | HIST1H1D | 3440446 | 4734 | 0.094 | -0.2088 | No | ||
| 10 | HIST3H2A | 1580504 | 5140 | 0.069 | -0.2295 | No | ||
| 11 | HIST1H3G | 5690524 | 5244 | 0.065 | -0.2340 | No | ||
| 12 | PLXNB1 | 6220273 | 6068 | 0.038 | -0.2778 | No | ||
| 13 | HIST1H2AA | 7050100 | 6512 | 0.027 | -0.3012 | No | ||
| 14 | TCF21 | 2690446 | 10494 | -0.047 | -0.5148 | No | ||
| 15 | SEZ6 | 3450722 | 10540 | -0.049 | -0.5165 | No | ||
| 16 | NOTCH4 | 2450040 6370707 | 11364 | -0.070 | -0.5597 | No | ||
| 17 | HIST1H3F | 2320441 2480022 3940170 | 12652 | -0.126 | -0.6271 | No | ||
| 18 | HIST1H1T | 130632 | 13324 | -0.175 | -0.6605 | No | ||
| 19 | GBX2 | 3940736 | 13406 | -0.182 | -0.6621 | No | ||
| 20 | HIST1H2AI | 4540039 | 13502 | -0.192 | -0.6642 | No | ||
| 21 | PHACTR3 | 3850435 5900445 | 14280 | -0.294 | -0.7015 | No | ||
| 22 | HIST1H1E | 6980706 | 14458 | -0.324 | -0.7061 | No | ||
| 23 | HIST1H2BA | 2450059 | 15764 | -0.716 | -0.7653 | No | ||
| 24 | HIST3H2BB | 70278 | 15860 | -0.774 | -0.7584 | No | ||
| 25 | HIST1H2BG | 5670632 | 16781 | -1.322 | -0.7875 | Yes | ||
| 26 | HIST1H2BB | 1340035 | 17199 | -1.635 | -0.7847 | Yes | ||
| 27 | UBE2C | 6130017 | 17457 | -1.873 | -0.7697 | Yes | ||
| 28 | HIST1H4A | 1940600 | 17766 | -2.198 | -0.7523 | Yes | ||
| 29 | HIST1H2BM | 3170168 | 17791 | -2.237 | -0.7190 | Yes | ||
| 30 | HIST1H2BJ | 2100551 | 17907 | -2.403 | -0.6881 | Yes | ||
| 31 | HIST1H2BL | 6380070 | 17980 | -2.511 | -0.6532 | Yes | ||
| 32 | HIST1H2BF | 5420402 | 17984 | -2.514 | -0.6145 | Yes | ||
| 33 | HIST1H2BN | 730128 | 18052 | -2.625 | -0.5776 | Yes | ||
| 34 | HIST1H2BH | 2450039 | 18091 | -2.668 | -0.5384 | Yes | ||
| 35 | HIST1H1B | 1410592 | 18186 | -2.853 | -0.4994 | Yes | ||
| 36 | HIST1H2AB | 2680465 | 18204 | -2.898 | -0.4555 | Yes | ||
| 37 | HIST1H3H | 2760288 | 18213 | -2.928 | -0.4108 | Yes | ||
| 38 | HIST1H2BK | 6130433 | 18216 | -2.931 | -0.3656 | Yes | ||
| 39 | HIST1H1A | 1450131 | 18248 | -3.006 | -0.3208 | Yes | ||
| 40 | HIST1H3I | 7100270 | 18376 | -3.385 | -0.2754 | Yes | ||
| 41 | HIST1H3B | 4780092 | 18381 | -3.395 | -0.2231 | Yes | ||
| 42 | HIST2H2BE | 3360184 | 18427 | -3.569 | -0.1704 | Yes | ||
| 43 | HIST1H3E | 840398 | 18444 | -3.628 | -0.1152 | Yes | ||
| 44 | HIST1H3D | 70687 | 18458 | -3.709 | -0.0586 | Yes | ||
| 45 | HIST1H3C | 730204 | 18541 | -4.344 | 0.0040 | Yes |

