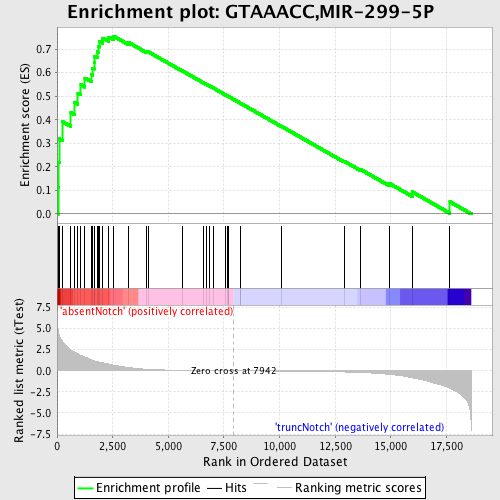
Profile of the Running ES Score & Positions of GeneSet Members on the Rank Ordered List
| Dataset | Set_03_absentNotch_versus_truncNotch.phenotype_absentNotch_versus_truncNotch.cls #absentNotch_versus_truncNotch.phenotype_absentNotch_versus_truncNotch.cls #absentNotch_versus_truncNotch_repos |
| Phenotype | phenotype_absentNotch_versus_truncNotch.cls#absentNotch_versus_truncNotch_repos |
| Upregulated in class | absentNotch |
| GeneSet | GTAAACC,MIR-299-5P |
| Enrichment Score (ES) | 0.7553029 |
| Normalized Enrichment Score (NES) | 1.8244562 |
| Nominal p-value | 0.0 |
| FDR q-value | 0.0021192688 |
| FWER p-Value | 0.012 |
| PROBE | DESCRIPTION (from dataset) | GENE SYMBOL | GENE_TITLE | RANK IN GENE LIST | RANK METRIC SCORE | RUNNING ES | CORE ENRICHMENT | |
|---|---|---|---|---|---|---|---|---|
| 1 | H3F3B | 1410300 | 42 | 4.822 | 0.1124 | Yes | ||
| 2 | CTCF | 5340017 | 61 | 4.586 | 0.2205 | Yes | ||
| 3 | PPP2R5A | 1990497 | 92 | 4.199 | 0.3187 | Yes | ||
| 4 | RAP2C | 1690132 | 251 | 3.418 | 0.3915 | Yes | ||
| 5 | ETF1 | 6770075 | 620 | 2.447 | 0.4299 | Yes | ||
| 6 | ZFX | 5900400 | 780 | 2.197 | 0.4736 | Yes | ||
| 7 | SOX4 | 2260091 | 935 | 1.992 | 0.5127 | Yes | ||
| 8 | MAFG | 4120440 | 1071 | 1.812 | 0.5485 | Yes | ||
| 9 | PURB | 5360138 | 1249 | 1.611 | 0.5773 | Yes | ||
| 10 | PHF12 | 870400 3130687 | 1546 | 1.295 | 0.5921 | Yes | ||
| 11 | GOLGA1 | 5860471 | 1597 | 1.247 | 0.6191 | Yes | ||
| 12 | INPP5A | 5910195 | 1663 | 1.177 | 0.6436 | Yes | ||
| 13 | ABCD3 | 7040341 | 1683 | 1.161 | 0.6702 | Yes | ||
| 14 | MECP2 | 1940450 | 1803 | 1.075 | 0.6893 | Yes | ||
| 15 | SFRS7 | 2760408 | 1858 | 1.040 | 0.7112 | Yes | ||
| 16 | SGK | 1400131 2480056 | 1900 | 1.013 | 0.7330 | Yes | ||
| 17 | MAT2A | 4070026 4730079 6020280 | 2051 | 0.938 | 0.7473 | Yes | ||
| 18 | CALU | 2680403 3520056 4610348 5720176 6130121 | 2324 | 0.779 | 0.7512 | Yes | ||
| 19 | CS | 5080600 | 2538 | 0.656 | 0.7553 | Yes | ||
| 20 | TNPO1 | 730092 2260735 | 3203 | 0.390 | 0.7288 | No | ||
| 21 | CNOT3 | 130519 4480292 1990609 | 3995 | 0.178 | 0.6905 | No | ||
| 22 | MAP3K8 | 2940286 | 4102 | 0.161 | 0.6886 | No | ||
| 23 | RSBN1 | 7000487 | 5617 | 0.051 | 0.6083 | No | ||
| 24 | TIPARP | 50397 | 6561 | 0.026 | 0.5582 | No | ||
| 25 | MYF6 | 2690576 | 6715 | 0.022 | 0.5505 | No | ||
| 26 | HSPA2 | 6420592 | 6832 | 0.020 | 0.5447 | No | ||
| 27 | TEAD1 | 2470551 | 7024 | 0.016 | 0.5348 | No | ||
| 28 | ATG5 | 6200433 5360324 | 7586 | 0.006 | 0.5047 | No | ||
| 29 | ROBO1 | 3710398 | 7656 | 0.005 | 0.5011 | No | ||
| 30 | PUM2 | 4200441 5910446 | 7693 | 0.004 | 0.4993 | No | ||
| 31 | ABR | 610079 1170609 3610195 5670050 | 7719 | 0.004 | 0.4980 | No | ||
| 32 | UBE2J2 | 4850019 5420717 | 8225 | -0.005 | 0.4710 | No | ||
| 33 | CAB39 | 5720471 | 8243 | -0.005 | 0.4702 | No | ||
| 34 | MAMDC1 | 3710129 4480075 | 10087 | -0.039 | 0.3719 | No | ||
| 35 | DLX2 | 2320438 4200673 | 12895 | -0.143 | 0.2242 | No | ||
| 36 | TCEAL8 | 4210408 | 13640 | -0.210 | 0.1891 | No | ||
| 37 | CPEB2 | 4760338 | 14942 | -0.423 | 0.1292 | No | ||
| 38 | TSPAN2 | 3940161 | 15958 | -0.822 | 0.0941 | No | ||
| 39 | IPO13 | 3870088 | 17657 | -2.058 | 0.0516 | No |

