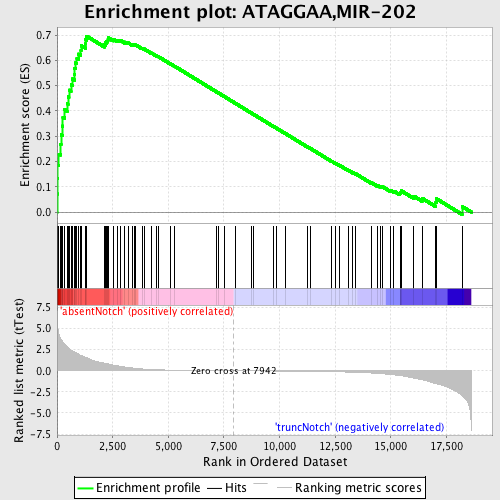
Profile of the Running ES Score & Positions of GeneSet Members on the Rank Ordered List
| Dataset | Set_03_absentNotch_versus_truncNotch.phenotype_absentNotch_versus_truncNotch.cls #absentNotch_versus_truncNotch.phenotype_absentNotch_versus_truncNotch.cls #absentNotch_versus_truncNotch_repos |
| Phenotype | phenotype_absentNotch_versus_truncNotch.cls#absentNotch_versus_truncNotch_repos |
| Upregulated in class | absentNotch |
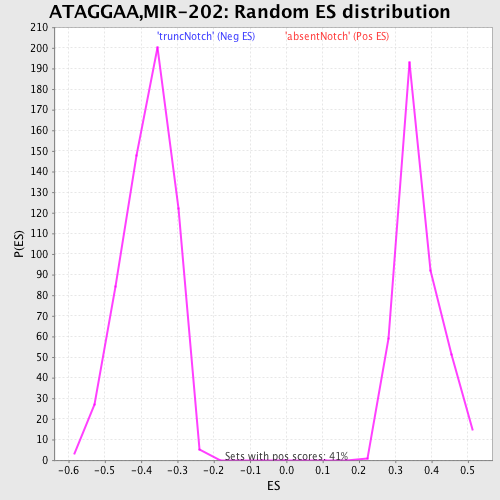
| GeneSet | ATAGGAA,MIR-202 |
| Enrichment Score (ES) | 0.69593954 |
| Normalized Enrichment Score (NES) | 1.9172716 |
| Nominal p-value | 0.0 |
| FDR q-value | 0.0035594425 |
| FWER p-Value | 0.0040 |
| PROBE | DESCRIPTION (from dataset) | GENE SYMBOL | GENE_TITLE | RANK IN GENE LIST | RANK METRIC SCORE | RUNNING ES | CORE ENRICHMENT | |
|---|---|---|---|---|---|---|---|---|
| 1 | LBR | 4540671 | 2 | 6.656 | 0.0719 | Yes | ||
| 2 | APPBP2 | 5130215 | 13 | 5.776 | 0.1339 | Yes | ||
| 3 | MAPK6 | 6760520 | 38 | 4.847 | 0.1851 | Yes | ||
| 4 | ANP32E | 6510706 | 81 | 4.345 | 0.2298 | Yes | ||
| 5 | KRAS | 2060170 | 159 | 3.794 | 0.2667 | Yes | ||
| 6 | RNF11 | 3990068 5080458 | 179 | 3.723 | 0.3060 | Yes | ||
| 7 | SFPQ | 4760110 | 235 | 3.477 | 0.3407 | Yes | ||
| 8 | SENP1 | 6100537 | 261 | 3.381 | 0.3759 | Yes | ||
| 9 | BAG4 | 2260070 | 344 | 3.077 | 0.4048 | Yes | ||
| 10 | MARCKS | 7040450 | 452 | 2.808 | 0.4294 | Yes | ||
| 11 | DDX3X | 2190020 | 494 | 2.725 | 0.4567 | Yes | ||
| 12 | CREBBP | 5690035 7040050 | 535 | 2.625 | 0.4829 | Yes | ||
| 13 | TTC13 | 3520750 | 627 | 2.440 | 0.5044 | Yes | ||
| 14 | CNN3 | 6110020 | 686 | 2.342 | 0.5267 | Yes | ||
| 15 | BTG1 | 4200735 6040131 6200133 | 783 | 2.195 | 0.5452 | Yes | ||
| 16 | RASA1 | 1240315 | 794 | 2.176 | 0.5683 | Yes | ||
| 17 | CD28 | 1400739 4210093 | 821 | 2.145 | 0.5901 | Yes | ||
| 18 | YAF2 | 940053 | 890 | 2.061 | 0.6087 | Yes | ||
| 19 | RAD52 | 110093 | 970 | 1.925 | 0.6253 | Yes | ||
| 20 | ELF1 | 4780450 | 1070 | 1.813 | 0.6396 | Yes | ||
| 21 | CBL | 6380068 | 1079 | 1.799 | 0.6586 | Yes | ||
| 22 | TCF12 | 3610324 7000156 | 1276 | 1.578 | 0.6651 | Yes | ||
| 23 | IQGAP1 | 6660494 | 1286 | 1.572 | 0.6816 | Yes | ||
| 24 | MIB1 | 3800537 | 1327 | 1.521 | 0.6959 | Yes | ||
| 25 | RPS6KA3 | 1980707 | 2130 | 0.889 | 0.6623 | No | ||
| 26 | RAB22A | 110500 3830707 | 2173 | 0.865 | 0.6694 | No | ||
| 27 | PTEN | 3390064 | 2217 | 0.838 | 0.6762 | No | ||
| 28 | STAT3 | 460040 3710341 | 2286 | 0.801 | 0.6812 | No | ||
| 29 | ZFAND3 | 2760504 | 2300 | 0.794 | 0.6890 | No | ||
| 30 | TRIM33 | 580619 2230280 3990433 6200747 | 2532 | 0.659 | 0.6837 | No | ||
| 31 | SORCS1 | 60411 5890373 | 2734 | 0.570 | 0.6790 | No | ||
| 32 | THRAP2 | 4920600 | 2843 | 0.524 | 0.6789 | No | ||
| 33 | CTBP2 | 430309 3710079 | 3047 | 0.445 | 0.6728 | No | ||
| 34 | PPP5C | 3130047 | 3194 | 0.394 | 0.6691 | No | ||
| 35 | BICD2 | 1090411 | 3393 | 0.330 | 0.6620 | No | ||
| 36 | SNX16 | 870446 | 3457 | 0.310 | 0.6620 | No | ||
| 37 | SPRED1 | 6940706 | 3530 | 0.286 | 0.6612 | No | ||
| 38 | LUZP1 | 940075 4280458 6180070 | 3827 | 0.213 | 0.6475 | No | ||
| 39 | ERBB2IP | 580253 1090672 | 3909 | 0.196 | 0.6453 | No | ||
| 40 | SNAP91 | 3170056 5690520 | 4235 | 0.142 | 0.6293 | No | ||
| 41 | ACVR1 | 6840671 | 4475 | 0.115 | 0.6177 | No | ||
| 42 | DNAJC10 | 2350601 | 4536 | 0.110 | 0.6156 | No | ||
| 43 | ACSL3 | 3140195 | 5101 | 0.072 | 0.5860 | No | ||
| 44 | ESR1 | 4060372 5860193 | 5289 | 0.063 | 0.5766 | No | ||
| 45 | KLF12 | 1660095 4810288 5340546 6520286 | 7159 | 0.014 | 0.4759 | No | ||
| 46 | USP15 | 610592 3520504 | 7236 | 0.012 | 0.4720 | No | ||
| 47 | KIAA1715 | 1190551 | 7501 | 0.008 | 0.4578 | No | ||
| 48 | NR2F2 | 3170609 3310577 | 8001 | -0.001 | 0.4309 | No | ||
| 49 | FAM60A | 3940092 | 8756 | -0.014 | 0.3904 | No | ||
| 50 | RNF121 | 110079 1580279 | 8847 | -0.015 | 0.3857 | No | ||
| 51 | HLF | 2370113 | 9743 | -0.031 | 0.3378 | No | ||
| 52 | ROBO2 | 450136 | 9842 | -0.033 | 0.3328 | No | ||
| 53 | KHDRBS2 | 3520717 | 10252 | -0.042 | 0.3112 | No | ||
| 54 | CPEB3 | 3940164 | 11250 | -0.066 | 0.2582 | No | ||
| 55 | USP8 | 2640347 3840451 6100672 | 11381 | -0.070 | 0.2519 | No | ||
| 56 | ATXN1 | 5550156 | 12348 | -0.109 | 0.2010 | No | ||
| 57 | PCGF2 | 6370347 | 12530 | -0.119 | 0.1925 | No | ||
| 58 | DDEF1 | 1170411 4070465 | 12698 | -0.129 | 0.1849 | No | ||
| 59 | ENAH | 1690292 5700300 | 13104 | -0.158 | 0.1648 | No | ||
| 60 | RKHD3 | 6180471 | 13297 | -0.173 | 0.1563 | No | ||
| 61 | HIP2 | 2810095 3990369 4120301 | 13428 | -0.184 | 0.1513 | No | ||
| 62 | ARSB | 3190093 5360491 | 14135 | -0.272 | 0.1162 | No | ||
| 63 | HOXB2 | 6450592 | 14396 | -0.314 | 0.1055 | No | ||
| 64 | NARG1 | 5910563 6350095 | 14518 | -0.334 | 0.1026 | No | ||
| 65 | BCL11A | 6860369 | 14617 | -0.352 | 0.1012 | No | ||
| 66 | SSBP2 | 2260725 2900400 4730711 | 14986 | -0.435 | 0.0860 | No | ||
| 67 | BCL2 | 730132 1570736 2470138 3800044 4810037 5690068 5860504 6650164 | 15135 | -0.474 | 0.0832 | No | ||
| 68 | GRIA3 | 2900164 6130278 6860154 | 15412 | -0.573 | 0.0745 | No | ||
| 69 | VANGL2 | 70097 870075 | 15443 | -0.584 | 0.0792 | No | ||
| 70 | EAF1 | 5420039 6550619 | 15467 | -0.592 | 0.0844 | No | ||
| 71 | EI24 | 3120433 | 16040 | -0.866 | 0.0629 | No | ||
| 72 | TARDBP | 870390 2350093 | 16405 | -1.070 | 0.0548 | No | ||
| 73 | PPARBP | 4280131 5690022 5860050 | 17023 | -1.509 | 0.0379 | No | ||
| 74 | TGFBR2 | 1780711 1980537 6550398 | 17052 | -1.525 | 0.0529 | No | ||
| 75 | NDRG1 | 1340040 | 18206 | -2.903 | 0.0221 | No |