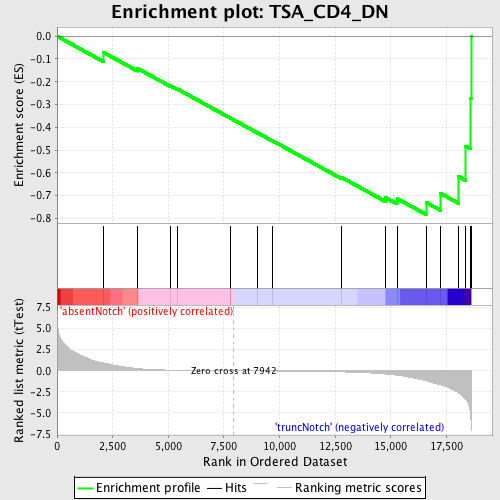
Profile of the Running ES Score & Positions of GeneSet Members on the Rank Ordered List
| Dataset | Set_03_absentNotch_versus_truncNotch.phenotype_absentNotch_versus_truncNotch.cls #absentNotch_versus_truncNotch.phenotype_absentNotch_versus_truncNotch.cls #absentNotch_versus_truncNotch_repos |
| Phenotype | phenotype_absentNotch_versus_truncNotch.cls#absentNotch_versus_truncNotch_repos |
| Upregulated in class | truncNotch |
| GeneSet | TSA_CD4_DN |
| Enrichment Score (ES) | -0.78294903 |
| Normalized Enrichment Score (NES) | -1.5327975 |
| Nominal p-value | 0.014059754 |
| FDR q-value | 0.5812373 |
| FWER p-Value | 1.0 |
| PROBE | DESCRIPTION (from dataset) | GENE SYMBOL | GENE_TITLE | RANK IN GENE LIST | RANK METRIC SCORE | RUNNING ES | CORE ENRICHMENT | |
|---|---|---|---|---|---|---|---|---|
| 1 | CX3CR1 | 1690577 | 2091 | 0.910 | -0.0715 | No | ||
| 2 | CD247 | 3800725 5720136 | 3605 | 0.264 | -0.1409 | No | ||
| 3 | OGDH | 3840333 6350100 | 5103 | 0.071 | -0.2182 | No | ||
| 4 | NOTCH2 | 2570397 | 5411 | 0.058 | -0.2321 | No | ||
| 5 | METAP2 | 1570441 4010026 4850204 | 7795 | 0.002 | -0.3601 | No | ||
| 6 | WNT4 | 4150619 | 7808 | 0.002 | -0.3606 | No | ||
| 7 | RARB | 430139 1410138 | 9020 | -0.018 | -0.4249 | No | ||
| 8 | WNT7A | 1170315 | 9665 | -0.030 | -0.4582 | No | ||
| 9 | ENTPD2 | 4590739 | 12797 | -0.136 | -0.6204 | No | ||
| 10 | FGF18 | 1410168 2190706 | 14756 | -0.382 | -0.7085 | No | ||
| 11 | LAT | 3170025 | 15281 | -0.527 | -0.7129 | No | ||
| 12 | CD3E | 3800056 | 16584 | -1.180 | -0.7298 | Yes | ||
| 13 | SLC3A2 | 5270358 | 17221 | -1.649 | -0.6898 | Yes | ||
| 14 | ICAM1 | 6980138 | 18039 | -2.609 | -0.6162 | Yes | ||
| 15 | CD3D | 2810739 | 18365 | -3.343 | -0.4831 | Yes | ||
| 16 | NOTCH1 | 3390114 | 18581 | -4.954 | -0.2717 | Yes | ||
| 17 | IL2RA | 6620450 | 18608 | -6.074 | 0.0004 | Yes |

