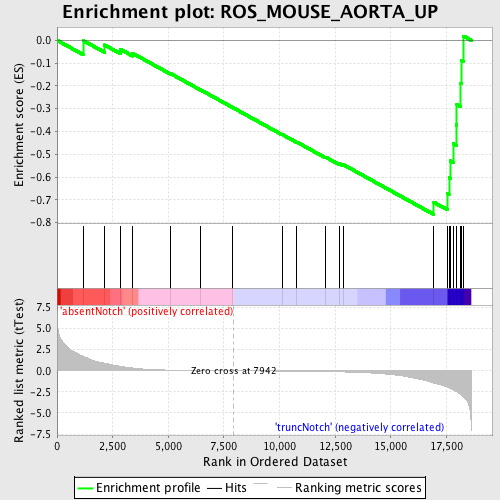
Profile of the Running ES Score & Positions of GeneSet Members on the Rank Ordered List
| Dataset | Set_03_absentNotch_versus_truncNotch.phenotype_absentNotch_versus_truncNotch.cls #absentNotch_versus_truncNotch.phenotype_absentNotch_versus_truncNotch.cls #absentNotch_versus_truncNotch_repos |
| Phenotype | phenotype_absentNotch_versus_truncNotch.cls#absentNotch_versus_truncNotch_repos |
| Upregulated in class | truncNotch |
| GeneSet | ROS_MOUSE_AORTA_UP |
| Enrichment Score (ES) | -0.76395977 |
| Normalized Enrichment Score (NES) | -1.5940003 |
| Nominal p-value | 0.0073394496 |
| FDR q-value | 0.3586155 |
| FWER p-Value | 0.973 |
| PROBE | DESCRIPTION (from dataset) | GENE SYMBOL | GENE_TITLE | RANK IN GENE LIST | RANK METRIC SCORE | RUNNING ES | CORE ENRICHMENT | |
|---|---|---|---|---|---|---|---|---|
| 1 | SLC25A5 | 1980672 | 1169 | 1.696 | -0.0009 | No | ||
| 2 | HSPD1 | 60097 2030451 | 2135 | 0.887 | -0.0204 | No | ||
| 3 | COX17 | 6250072 | 2844 | 0.524 | -0.0393 | No | ||
| 4 | CIB2 | 1740131 4760594 | 3395 | 0.330 | -0.0568 | No | ||
| 5 | ATP5G3 | 4230551 | 5095 | 0.072 | -0.1456 | No | ||
| 6 | CES1 | 1400494 | 6464 | 0.028 | -0.2181 | No | ||
| 7 | PPARA | 2060026 | 7862 | 0.001 | -0.2932 | No | ||
| 8 | AKT2 | 3850541 3870519 | 10110 | -0.039 | -0.4126 | No | ||
| 9 | FABP3 | 6860452 | 10781 | -0.054 | -0.4466 | No | ||
| 10 | AQP7 | 2760576 2810072 2940722 | 12070 | -0.095 | -0.5124 | No | ||
| 11 | CYP4B1 | 2570139 | 12685 | -0.128 | -0.5407 | No | ||
| 12 | THEM2 | 6840746 | 12874 | -0.142 | -0.5457 | No | ||
| 13 | SDHB | 3120398 4780113 3710435 | 16934 | -1.463 | -0.7105 | Yes | ||
| 14 | DGAT1 | 1850538 | 17546 | -1.947 | -0.6722 | Yes | ||
| 15 | PEX6 | 2100253 6660162 | 17617 | -2.024 | -0.6019 | Yes | ||
| 16 | PNPLA2 | 4920520 | 17673 | -2.077 | -0.5290 | Yes | ||
| 17 | MRPL4 | 2680050 | 17820 | -2.270 | -0.4539 | Yes | ||
| 18 | UBE2M | 2450215 | 17938 | -2.444 | -0.3708 | Yes | ||
| 19 | TYSND1 | 2940273 | 17968 | -2.496 | -0.2811 | Yes | ||
| 20 | NDUFB10 | 5900576 | 18146 | -2.769 | -0.1894 | Yes | ||
| 21 | VEGFB | 5360152 | 18162 | -2.797 | -0.0880 | Yes | ||
| 22 | NDUFS3 | 1690136 5340528 | 18273 | -3.073 | 0.0184 | Yes |

