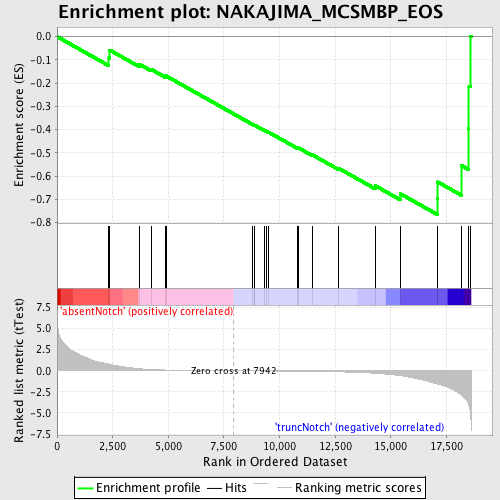
Profile of the Running ES Score & Positions of GeneSet Members on the Rank Ordered List
| Dataset | Set_03_absentNotch_versus_truncNotch.phenotype_absentNotch_versus_truncNotch.cls #absentNotch_versus_truncNotch.phenotype_absentNotch_versus_truncNotch.cls #absentNotch_versus_truncNotch_repos |
| Phenotype | phenotype_absentNotch_versus_truncNotch.cls#absentNotch_versus_truncNotch_repos |
| Upregulated in class | truncNotch |
| GeneSet | NAKAJIMA_MCSMBP_EOS |
| Enrichment Score (ES) | -0.7647603 |
| Normalized Enrichment Score (NES) | -1.6166557 |
| Nominal p-value | 0.0017793594 |
| FDR q-value | 0.3950783 |
| FWER p-Value | 0.927 |
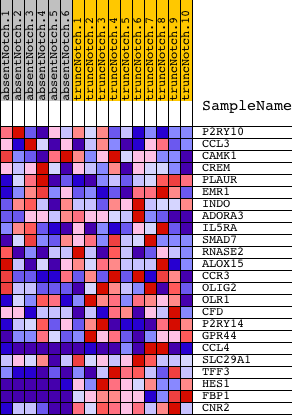
| PROBE | DESCRIPTION (from dataset) | GENE SYMBOL | GENE_TITLE | RANK IN GENE LIST | RANK METRIC SCORE | RUNNING ES | CORE ENRICHMENT | |
|---|---|---|---|---|---|---|---|---|
| 1 | P2RY10 | 6370039 6840204 | 2331 | 0.775 | -0.0904 | No | ||
| 2 | CCL3 | 2810092 | 2363 | 0.760 | -0.0577 | No | ||
| 3 | CAMK1 | 3390427 5220086 6940504 | 3696 | 0.241 | -0.1185 | No | ||
| 4 | CREM | 840156 6380438 6660041 6660168 | 4221 | 0.144 | -0.1402 | No | ||
| 5 | PLAUR | 5910280 | 4858 | 0.085 | -0.1705 | No | ||
| 6 | EMR1 | 70136 1500592 | 4894 | 0.083 | -0.1687 | No | ||
| 7 | INDO | 2680390 | 8791 | -0.014 | -0.3776 | No | ||
| 8 | ADORA3 | 630333 | 8855 | -0.015 | -0.3803 | No | ||
| 9 | IL5RA | 4540091 | 8874 | -0.015 | -0.3805 | No | ||
| 10 | SMAD7 | 430377 | 9316 | -0.023 | -0.4032 | No | ||
| 11 | RNASE2 | 3290563 | 9423 | -0.025 | -0.4078 | No | ||
| 12 | ALOX15 | 6620333 | 9509 | -0.027 | -0.4111 | No | ||
| 13 | CCR3 | 50427 | 10800 | -0.055 | -0.4781 | No | ||
| 14 | OLIG2 | 6660402 | 10856 | -0.055 | -0.4785 | No | ||
| 15 | OLR1 | 50025 3840484 | 11475 | -0.073 | -0.5084 | No | ||
| 16 | CFD | 2320736 | 12633 | -0.125 | -0.5650 | No | ||
| 17 | P2RY14 | 6100497 | 14307 | -0.298 | -0.6415 | No | ||
| 18 | GPR44 | 4050452 | 15432 | -0.581 | -0.6757 | No | ||
| 19 | CCL4 | 50368 430047 | 17088 | -1.550 | -0.6947 | Yes | ||
| 20 | SLC29A1 | 2970379 | 17108 | -1.566 | -0.6250 | Yes | ||
| 21 | TFF3 | 1580129 | 18177 | -2.835 | -0.5544 | Yes | ||
| 22 | HES1 | 4810280 | 18487 | -3.885 | -0.3955 | Yes | ||
| 23 | FBP1 | 1470762 | 18512 | -4.079 | -0.2126 | Yes | ||
| 24 | CNR2 | 2760398 | 18574 | -4.829 | 0.0023 | Yes |