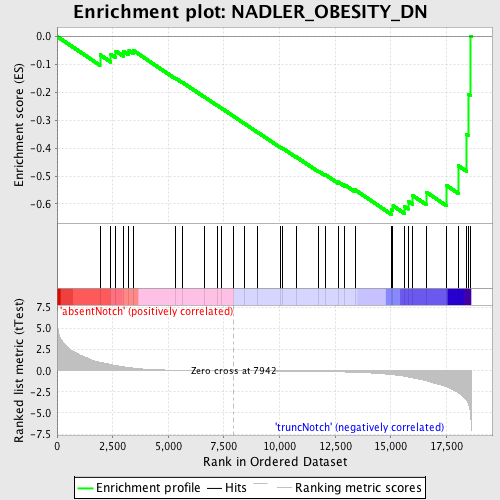
Profile of the Running ES Score & Positions of GeneSet Members on the Rank Ordered List
| Dataset | Set_03_absentNotch_versus_truncNotch.phenotype_absentNotch_versus_truncNotch.cls #absentNotch_versus_truncNotch.phenotype_absentNotch_versus_truncNotch.cls #absentNotch_versus_truncNotch_repos |
| Phenotype | phenotype_absentNotch_versus_truncNotch.cls#absentNotch_versus_truncNotch_repos |
| Upregulated in class | truncNotch |
| GeneSet | NADLER_OBESITY_DN |
| Enrichment Score (ES) | -0.6378329 |
| Normalized Enrichment Score (NES) | -1.4891249 |
| Nominal p-value | 0.024561403 |
| FDR q-value | 0.63119817 |
| FWER p-Value | 1.0 |
| PROBE | DESCRIPTION (from dataset) | GENE SYMBOL | GENE_TITLE | RANK IN GENE LIST | RANK METRIC SCORE | RUNNING ES | CORE ENRICHMENT | |
|---|---|---|---|---|---|---|---|---|
| 1 | B2M | 5080332 5130059 | 1928 | 1.000 | -0.0656 | No | ||
| 2 | DBI | 1090706 | 2417 | 0.729 | -0.0641 | No | ||
| 3 | APOE | 4200671 | 2641 | 0.615 | -0.0527 | No | ||
| 4 | ALDH2 | 4230019 | 2977 | 0.471 | -0.0528 | No | ||
| 5 | BCAT2 | 5890112 | 3229 | 0.382 | -0.0517 | No | ||
| 6 | GPD2 | 2350075 2690411 | 3436 | 0.314 | -0.0508 | No | ||
| 7 | RASD1 | 2450463 | 5315 | 0.062 | -0.1495 | No | ||
| 8 | UBB | 4810138 | 5633 | 0.051 | -0.1646 | No | ||
| 9 | FDFT1 | 5340039 | 6620 | 0.024 | -0.2167 | No | ||
| 10 | NNAT | 4920053 5130253 | 7202 | 0.013 | -0.2475 | No | ||
| 11 | SREBF1 | 4780333 | 7390 | 0.009 | -0.2572 | No | ||
| 12 | THRSP | 6980142 | 7909 | 0.001 | -0.2851 | No | ||
| 13 | RBP4 | 4540131 | 8423 | -0.008 | -0.3124 | No | ||
| 14 | GBE1 | 2190368 | 9010 | -0.018 | -0.3432 | No | ||
| 15 | GSTA3 | 2470193 | 10040 | -0.038 | -0.3971 | No | ||
| 16 | FABP4 | 5050114 | 10118 | -0.039 | -0.3998 | No | ||
| 17 | TSHR | 1190687 5270364 | 10741 | -0.053 | -0.4312 | No | ||
| 18 | ADRB3 | 6900072 | 11749 | -0.082 | -0.4823 | No | ||
| 19 | FMO1 | 5360086 | 12061 | -0.095 | -0.4954 | No | ||
| 20 | CFD | 2320736 | 12633 | -0.125 | -0.5213 | No | ||
| 21 | PCK1 | 7000358 | 12936 | -0.146 | -0.5320 | No | ||
| 22 | AGT | 7000575 | 13394 | -0.180 | -0.5497 | No | ||
| 23 | HP | 2940551 6350068 | 15032 | -0.448 | -0.6208 | Yes | ||
| 24 | CDKN2C | 5050750 5130148 | 15096 | -0.464 | -0.6065 | Yes | ||
| 25 | UCK1 | 2650398 3130113 5130725 | 15615 | -0.648 | -0.6096 | Yes | ||
| 26 | SOD1 | 5890070 | 15777 | -0.724 | -0.5907 | Yes | ||
| 27 | EEF1A1 | 1980193 1990195 4670735 | 15982 | -0.835 | -0.5699 | Yes | ||
| 28 | ASNS | 110368 7100687 | 16591 | -1.182 | -0.5575 | Yes | ||
| 29 | COX8A | 3780500 | 17515 | -1.912 | -0.5343 | Yes | ||
| 30 | DDT | 4590398 | 18031 | -2.592 | -0.4633 | Yes | ||
| 31 | PYGB | 2510731 | 18413 | -3.499 | -0.3504 | Yes | ||
| 32 | C2 | 5390465 | 18488 | -3.885 | -0.2063 | Yes | ||
| 33 | ALDOA | 6290672 | 18596 | -5.593 | 0.0011 | Yes |

