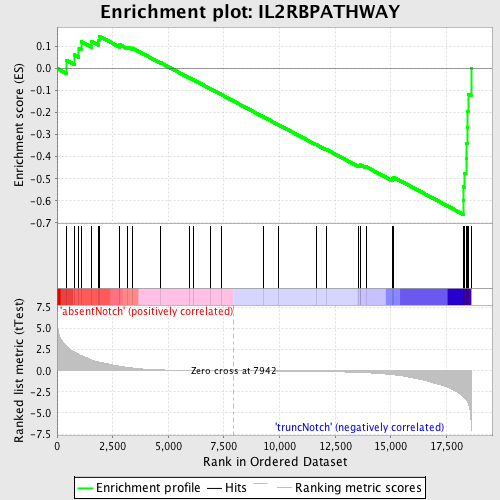
Profile of the Running ES Score & Positions of GeneSet Members on the Rank Ordered List
| Dataset | Set_03_absentNotch_versus_truncNotch.phenotype_absentNotch_versus_truncNotch.cls #absentNotch_versus_truncNotch.phenotype_absentNotch_versus_truncNotch.cls #absentNotch_versus_truncNotch_repos |
| Phenotype | phenotype_absentNotch_versus_truncNotch.cls#absentNotch_versus_truncNotch_repos |
| Upregulated in class | truncNotch |
| GeneSet | IL2RBPATHWAY |
| Enrichment Score (ES) | -0.6621148 |
| Normalized Enrichment Score (NES) | -1.5128406 |
| Nominal p-value | 0.017667845 |
| FDR q-value | 0.69785476 |
| FWER p-Value | 1.0 |
| PROBE | DESCRIPTION (from dataset) | GENE SYMBOL | GENE_TITLE | RANK IN GENE LIST | RANK METRIC SCORE | RUNNING ES | CORE ENRICHMENT | |
|---|---|---|---|---|---|---|---|---|
| 1 | CRKL | 4050427 | 415 | 2.887 | 0.0367 | No | ||
| 2 | RAF1 | 1770600 | 782 | 2.195 | 0.0619 | No | ||
| 3 | GRB2 | 6650398 | 982 | 1.909 | 0.0903 | No | ||
| 4 | CBL | 6380068 | 1079 | 1.799 | 0.1219 | No | ||
| 5 | E2F1 | 5360093 | 1556 | 1.284 | 0.1226 | No | ||
| 6 | MAPK1 | 3190193 6200253 | 1876 | 1.029 | 0.1265 | No | ||
| 7 | IL2RG | 4120273 | 1887 | 1.019 | 0.1468 | No | ||
| 8 | BCL2L1 | 1580452 4200152 5420484 | 2821 | 0.530 | 0.1074 | No | ||
| 9 | SHC1 | 2900731 3170504 6520537 | 3176 | 0.398 | 0.0965 | No | ||
| 10 | MYC | 380541 4670170 | 3372 | 0.337 | 0.0929 | No | ||
| 11 | RPS6KB1 | 1450427 5080110 6200563 | 4657 | 0.099 | 0.0259 | No | ||
| 12 | PIK3CA | 6220129 | 5960 | 0.041 | -0.0434 | No | ||
| 13 | CFLAR | 2320605 6180440 | 6118 | 0.036 | -0.0511 | No | ||
| 14 | SYK | 6940133 | 6907 | 0.018 | -0.0931 | No | ||
| 15 | AKT1 | 5290746 | 7382 | 0.010 | -0.1184 | No | ||
| 16 | IRS1 | 1190204 | 9291 | -0.023 | -0.2206 | No | ||
| 17 | PIK3R1 | 4730671 | 9937 | -0.035 | -0.2546 | No | ||
| 18 | NMI | 520270 | 11645 | -0.079 | -0.3449 | No | ||
| 19 | SOS1 | 7050338 | 12089 | -0.096 | -0.3667 | No | ||
| 20 | SOCS1 | 730139 | 13530 | -0.195 | -0.4402 | No | ||
| 21 | JAK1 | 5910746 | 13622 | -0.207 | -0.4409 | No | ||
| 22 | STAT5B | 6200026 | 13637 | -0.210 | -0.4374 | No | ||
| 23 | FOS | 1850315 | 13888 | -0.238 | -0.4459 | No | ||
| 24 | PPIA | 2900368 4850162 | 15071 | -0.459 | -0.5002 | No | ||
| 25 | BCL2 | 730132 1570736 2470138 3800044 4810037 5690068 5860504 6650164 | 15135 | -0.474 | -0.4938 | No | ||
| 26 | SOCS3 | 5550563 | 18263 | -3.056 | -0.5996 | Yes | ||
| 27 | PTPN6 | 4230128 | 18276 | -3.085 | -0.5371 | Yes | ||
| 28 | IL2RB | 4730072 | 18307 | -3.163 | -0.4740 | Yes | ||
| 29 | MAPK3 | 580161 4780035 | 18380 | -3.390 | -0.4086 | Yes | ||
| 30 | STAT5A | 2680458 | 18406 | -3.478 | -0.3388 | Yes | ||
| 31 | JAK3 | 70347 3290008 | 18433 | -3.588 | -0.2667 | Yes | ||
| 32 | HRAS | 1980551 | 18441 | -3.618 | -0.1931 | Yes | ||
| 33 | BAD | 2120148 | 18473 | -3.821 | -0.1166 | Yes | ||
| 34 | IL2RA | 6620450 | 18608 | -6.074 | 0.0004 | Yes |

