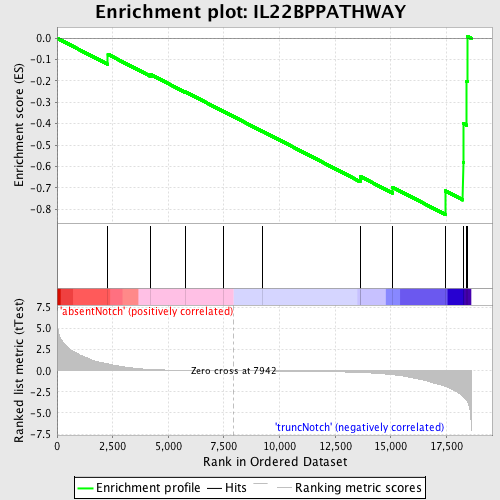
Profile of the Running ES Score & Positions of GeneSet Members on the Rank Ordered List
| Dataset | Set_03_absentNotch_versus_truncNotch.phenotype_absentNotch_versus_truncNotch.cls #absentNotch_versus_truncNotch.phenotype_absentNotch_versus_truncNotch.cls #absentNotch_versus_truncNotch_repos |
| Phenotype | phenotype_absentNotch_versus_truncNotch.cls#absentNotch_versus_truncNotch_repos |
| Upregulated in class | truncNotch |
| GeneSet | IL22BPPATHWAY |
| Enrichment Score (ES) | -0.8249267 |
| Normalized Enrichment Score (NES) | -1.5510592 |
| Nominal p-value | 0.009276438 |
| FDR q-value | 0.49043664 |
| FWER p-Value | 0.999 |
| PROBE | DESCRIPTION (from dataset) | GENE SYMBOL | GENE_TITLE | RANK IN GENE LIST | RANK METRIC SCORE | RUNNING ES | CORE ENRICHMENT | |
|---|---|---|---|---|---|---|---|---|
| 1 | STAT3 | 460040 3710341 | 2286 | 0.801 | -0.0754 | No | ||
| 2 | JAK2 | 3780528 6100692 6550577 | 4205 | 0.147 | -0.1699 | No | ||
| 3 | IL22RA1 | 5720603 | 5772 | 0.046 | -0.2513 | No | ||
| 4 | IL22 | 1660102 | 7496 | 0.008 | -0.3435 | No | ||
| 5 | IL22RA2 | 460113 | 9215 | -0.021 | -0.4346 | No | ||
| 6 | JAK1 | 5910746 | 13622 | -0.207 | -0.6591 | No | ||
| 7 | STAT5B | 6200026 | 13637 | -0.210 | -0.6474 | No | ||
| 8 | STAT1 | 6510204 6590553 | 15078 | -0.460 | -0.6976 | No | ||
| 9 | IL10RA | 1770164 | 17448 | -1.864 | -0.7145 | Yes | ||
| 10 | TYK2 | 1660465 1740736 | 18244 | -2.995 | -0.5798 | Yes | ||
| 11 | SOCS3 | 5550563 | 18263 | -3.056 | -0.3997 | Yes | ||
| 12 | STAT5A | 2680458 | 18406 | -3.478 | -0.2013 | Yes | ||
| 13 | JAK3 | 70347 3290008 | 18433 | -3.588 | 0.0098 | Yes |

