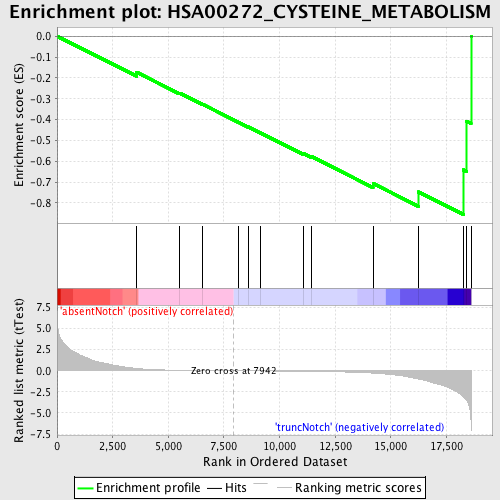
Profile of the Running ES Score & Positions of GeneSet Members on the Rank Ordered List
| Dataset | Set_03_absentNotch_versus_truncNotch.phenotype_absentNotch_versus_truncNotch.cls #absentNotch_versus_truncNotch.phenotype_absentNotch_versus_truncNotch.cls #absentNotch_versus_truncNotch_repos |
| Phenotype | phenotype_absentNotch_versus_truncNotch.cls#absentNotch_versus_truncNotch_repos |
| Upregulated in class | truncNotch |
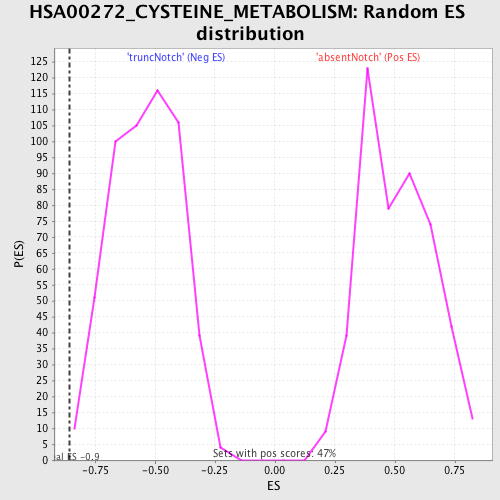
| GeneSet | HSA00272_CYSTEINE_METABOLISM |
| Enrichment Score (ES) | -0.855433 |
| Normalized Enrichment Score (NES) | -1.5907284 |
| Nominal p-value | 0.0018832391 |
| FDR q-value | 0.33587173 |
| FWER p-Value | 0.979 |
| PROBE | DESCRIPTION (from dataset) | GENE SYMBOL | GENE_TITLE | RANK IN GENE LIST | RANK METRIC SCORE | RUNNING ES | CORE ENRICHMENT | |
|---|---|---|---|---|---|---|---|---|
| 1 | CTH | 1190332 5290139 | 3570 | 0.274 | -0.1727 | No | ||
| 2 | LDHAL6B | 5130280 | 5512 | 0.054 | -0.2732 | No | ||
| 3 | SULT1B1 | 2230750 5700102 | 6540 | 0.026 | -0.3266 | No | ||
| 4 | LDHC | 2030458 6100463 | 8132 | -0.003 | -0.4119 | No | ||
| 5 | CDO1 | 2480279 | 8582 | -0.011 | -0.4353 | No | ||
| 6 | SULT4A1 | 5270161 | 9147 | -0.020 | -0.4642 | No | ||
| 7 | CARS | 460441 3140341 | 11053 | -0.060 | -0.5624 | No | ||
| 8 | SDS | 110242 6380725 | 11448 | -0.073 | -0.5784 | No | ||
| 9 | SULT1C2 | 1740348 5910538 | 14201 | -0.282 | -0.7066 | No | ||
| 10 | LDHA | 2190594 | 16245 | -0.987 | -0.7472 | Yes | ||
| 11 | MPST | 6380373 | 18259 | -3.051 | -0.6415 | Yes | ||
| 12 | GOT1 | 2940465 | 18396 | -3.438 | -0.4077 | Yes | ||
| 13 | GOT2 | 4570164 5220450 | 18606 | -5.982 | 0.0005 | Yes |