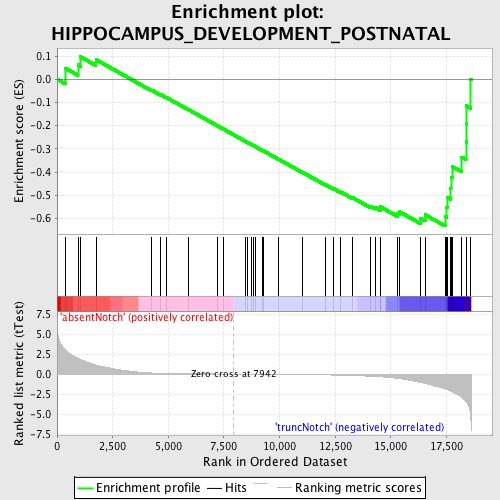
Profile of the Running ES Score & Positions of GeneSet Members on the Rank Ordered List
| Dataset | Set_03_absentNotch_versus_truncNotch.phenotype_absentNotch_versus_truncNotch.cls #absentNotch_versus_truncNotch.phenotype_absentNotch_versus_truncNotch.cls #absentNotch_versus_truncNotch_repos |
| Phenotype | phenotype_absentNotch_versus_truncNotch.cls#absentNotch_versus_truncNotch_repos |
| Upregulated in class | truncNotch |
| GeneSet | HIPPOCAMPUS_DEVELOPMENT_POSTNATAL |
| Enrichment Score (ES) | -0.6324974 |
| Normalized Enrichment Score (NES) | -1.5014982 |
| Nominal p-value | 0.019538188 |
| FDR q-value | 0.61090624 |
| FWER p-Value | 1.0 |
| PROBE | DESCRIPTION (from dataset) | GENE SYMBOL | GENE_TITLE | RANK IN GENE LIST | RANK METRIC SCORE | RUNNING ES | CORE ENRICHMENT | |
|---|---|---|---|---|---|---|---|---|
| 1 | ATP6V1C1 | 2690324 5220528 | 371 | 3.011 | 0.0477 | No | ||
| 2 | ATP2A2 | 1090075 3990279 | 939 | 1.987 | 0.0619 | No | ||
| 3 | PKM2 | 6520403 70500 | 1058 | 1.826 | 0.0966 | No | ||
| 4 | VDAC1 | 4760059 | 1747 | 1.117 | 0.0846 | No | ||
| 5 | MDH1 | 6660358 6760731 | 4243 | 0.141 | -0.0465 | No | ||
| 6 | STXBP1 | 360072 6220717 | 4668 | 0.099 | -0.0671 | No | ||
| 7 | PYGM | 3940300 | 4912 | 0.082 | -0.0784 | No | ||
| 8 | KCNMA1 | 1450402 | 5915 | 0.042 | -0.1314 | No | ||
| 9 | SDHA | 7000056 | 7188 | 0.013 | -0.1995 | No | ||
| 10 | PPP3CA | 4760332 6760092 | 7457 | 0.008 | -0.2138 | No | ||
| 11 | RYR2 | 2760671 | 8449 | -0.008 | -0.2669 | No | ||
| 12 | SOX10 | 6200538 | 8570 | -0.010 | -0.2732 | No | ||
| 13 | GRIA2 | 5080088 | 8755 | -0.014 | -0.2828 | No | ||
| 14 | ENO2 | 2320068 | 8820 | -0.015 | -0.2859 | No | ||
| 15 | SH3GL2 | 1990176 3830494 | 8909 | -0.016 | -0.2903 | No | ||
| 16 | GRIA1 | 1340152 3780750 4920440 | 9247 | -0.022 | -0.3079 | No | ||
| 17 | SIRT3 | 4010440 6040431 | 9272 | -0.022 | -0.3087 | No | ||
| 18 | BDNF | 2940128 3520368 | 9969 | -0.036 | -0.3454 | No | ||
| 19 | GRINA | 4570519 | 11030 | -0.060 | -0.4011 | No | ||
| 20 | CX3CL1 | 3990707 | 12078 | -0.096 | -0.4553 | No | ||
| 21 | IGHMBP2 | 2350292 | 12426 | -0.113 | -0.4714 | No | ||
| 22 | EEF1A2 | 2260162 5290086 | 12751 | -0.134 | -0.4859 | No | ||
| 23 | PRDX6 | 4920397 6380601 | 13270 | -0.171 | -0.5099 | No | ||
| 24 | NTSR2 | 380047 | 14080 | -0.262 | -0.5476 | No | ||
| 25 | NRGN | 4280433 | 14300 | -0.297 | -0.5527 | No | ||
| 26 | NDUFS2 | 4850020 6200402 | 14525 | -0.335 | -0.5572 | No | ||
| 27 | ATP6V0C | 1780609 | 14530 | -0.337 | -0.5499 | No | ||
| 28 | NDUFB2 | 1230750 | 15313 | -0.538 | -0.5799 | No | ||
| 29 | BIN1 | 5420348 5670500 | 15390 | -0.565 | -0.5713 | No | ||
| 30 | RAB3A | 3940288 | 16323 | -1.023 | -0.5984 | Yes | ||
| 31 | TYRO3 | 3130193 | 16543 | -1.158 | -0.5842 | Yes | ||
| 32 | VAMP2 | 2100100 | 17441 | -1.856 | -0.5908 | Yes | ||
| 33 | COX8A | 3780500 | 17515 | -1.912 | -0.5517 | Yes | ||
| 34 | CLTB | 5550037 | 17557 | -1.957 | -0.5099 | Yes | ||
| 35 | DGKZ | 3460041 6400129 | 17689 | -2.098 | -0.4698 | Yes | ||
| 36 | PFKL | 6200167 | 17705 | -2.120 | -0.4230 | Yes | ||
| 37 | EGR1 | 4610347 | 17755 | -2.187 | -0.3764 | Yes | ||
| 38 | TPI1 | 1500215 2100154 | 18184 | -2.852 | -0.3353 | Yes | ||
| 39 | MAPK3 | 580161 4780035 | 18380 | -3.390 | -0.2696 | Yes | ||
| 40 | NAPA | 1780537 5720102 | 18403 | -3.466 | -0.1929 | Yes | ||
| 41 | AIP | 5720300 | 18409 | -3.492 | -0.1146 | Yes | ||
| 42 | ALDOA | 6290672 | 18596 | -5.593 | 0.0011 | Yes |

