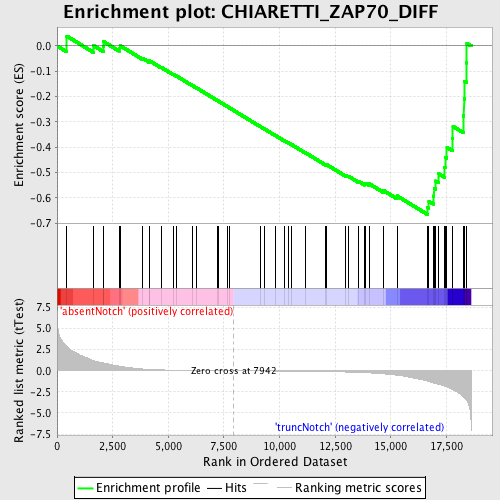
Profile of the Running ES Score & Positions of GeneSet Members on the Rank Ordered List
| Dataset | Set_03_absentNotch_versus_truncNotch.phenotype_absentNotch_versus_truncNotch.cls #absentNotch_versus_truncNotch.phenotype_absentNotch_versus_truncNotch.cls #absentNotch_versus_truncNotch_repos |
| Phenotype | phenotype_absentNotch_versus_truncNotch.cls#absentNotch_versus_truncNotch_repos |
| Upregulated in class | truncNotch |
| GeneSet | CHIARETTI_ZAP70_DIFF |
| Enrichment Score (ES) | -0.6658371 |
| Normalized Enrichment Score (NES) | -1.6592951 |
| Nominal p-value | 0.0 |
| FDR q-value | 0.9224141 |
| FWER p-Value | 0.688 |
| PROBE | DESCRIPTION (from dataset) | GENE SYMBOL | GENE_TITLE | RANK IN GENE LIST | RANK METRIC SCORE | RUNNING ES | CORE ENRICHMENT | |
|---|---|---|---|---|---|---|---|---|
| 1 | AGPS | 6980184 | 437 | 2.837 | 0.0390 | No | ||
| 2 | TCF20 | 1190338 1240520 4070594 4810440 | 1623 | 1.222 | 0.0021 | No | ||
| 3 | BRF1 | 2100047 | 2078 | 0.919 | -0.0021 | No | ||
| 4 | CASP8 | 4850154 | 2097 | 0.907 | 0.0170 | No | ||
| 5 | GAB1 | 2970156 | 2785 | 0.546 | -0.0080 | No | ||
| 6 | AP3D1 | 4540138 | 2826 | 0.529 | 0.0015 | No | ||
| 7 | STK39 | 50692 | 3853 | 0.207 | -0.0492 | No | ||
| 8 | TRIP6 | 6520609 | 4131 | 0.157 | -0.0606 | No | ||
| 9 | GRIN1 | 3800014 7000609 | 4164 | 0.152 | -0.0590 | No | ||
| 10 | ITGA5 | 5550520 | 4682 | 0.098 | -0.0847 | No | ||
| 11 | BAIAP2 | 460347 4730600 | 5236 | 0.065 | -0.1130 | No | ||
| 12 | MYBL1 | 2900168 | 5359 | 0.060 | -0.1183 | No | ||
| 13 | SPINK1 | 1580008 | 6097 | 0.037 | -0.1572 | No | ||
| 14 | IGJ | 1170541 | 6253 | 0.033 | -0.1648 | No | ||
| 15 | RQCD1 | 1850139 | 7199 | 0.013 | -0.2154 | No | ||
| 16 | EPM2AIP1 | 3360452 6590736 | 7271 | 0.011 | -0.2190 | No | ||
| 17 | SF3B3 | 3710044 | 7636 | 0.005 | -0.2385 | No | ||
| 18 | PDE9A | 5130167 | 7749 | 0.003 | -0.2444 | No | ||
| 19 | CTGF | 4540577 | 9137 | -0.020 | -0.3187 | No | ||
| 20 | CNOT8 | 4590129 | 9330 | -0.023 | -0.3285 | No | ||
| 21 | GPR56 | 1190494 | 9821 | -0.033 | -0.3542 | No | ||
| 22 | ACVR2A | 6110647 | 10239 | -0.042 | -0.3757 | No | ||
| 23 | HPN | 2470167 5220181 | 10380 | -0.045 | -0.3823 | No | ||
| 24 | CRADD | 6770520 | 10549 | -0.049 | -0.3903 | No | ||
| 25 | CKMT2 | 1580288 | 11169 | -0.063 | -0.4222 | No | ||
| 26 | LRRC15 | 3940609 | 12076 | -0.096 | -0.4689 | No | ||
| 27 | TTN | 2320161 4670056 6550026 | 12124 | -0.098 | -0.4693 | No | ||
| 28 | DGKA | 5720152 5890328 | 12976 | -0.149 | -0.5118 | No | ||
| 29 | TNFRSF1B | 3990035 5860372 | 13080 | -0.157 | -0.5139 | No | ||
| 30 | SOCS1 | 730139 | 13530 | -0.195 | -0.5338 | No | ||
| 31 | XPC | 6370193 | 13823 | -0.231 | -0.5444 | No | ||
| 32 | PBX3 | 1300424 3710577 6180575 | 13878 | -0.236 | -0.5421 | No | ||
| 33 | BBC3 | 2510494 4810278 | 14032 | -0.256 | -0.5447 | No | ||
| 34 | SEMA6A | 2690138 3060021 | 14658 | -0.359 | -0.5705 | No | ||
| 35 | LAT | 3170025 | 15281 | -0.527 | -0.5924 | No | ||
| 36 | CD200 | 940725 5260647 | 16646 | -1.228 | -0.6388 | Yes | ||
| 37 | PCSK7 | 6370450 | 16712 | -1.273 | -0.6142 | Yes | ||
| 38 | CDK9 | 630707 | 16907 | -1.447 | -0.5927 | Yes | ||
| 39 | SLC2A1 | 2100609 | 16940 | -1.465 | -0.5622 | Yes | ||
| 40 | LCK | 3360142 | 17025 | -1.510 | -0.5334 | Yes | ||
| 41 | RRAD | 4280129 | 17155 | -1.596 | -0.5052 | Yes | ||
| 42 | PTPN18 | 2640537 | 17411 | -1.825 | -0.4787 | Yes | ||
| 43 | ANXA11 | 6370128 | 17444 | -1.860 | -0.4394 | Yes | ||
| 44 | ACOT8 | 2940039 5420025 | 17524 | -1.923 | -0.4012 | Yes | ||
| 45 | IL27RA | 940093 | 17776 | -2.211 | -0.3660 | Yes | ||
| 46 | CTSW | 360368 | 17793 | -2.238 | -0.3175 | Yes | ||
| 47 | ZAP70 | 1410494 2260504 | 18258 | -3.049 | -0.2753 | Yes | ||
| 48 | PHC2 | 1430433 | 18289 | -3.113 | -0.2083 | Yes | ||
| 49 | FGR | 3780047 | 18321 | -3.215 | -0.1391 | Yes | ||
| 50 | AIP | 5720300 | 18409 | -3.492 | -0.0668 | Yes | ||
| 51 | HPS1 | 2510026 | 18420 | -3.532 | 0.0106 | Yes |

