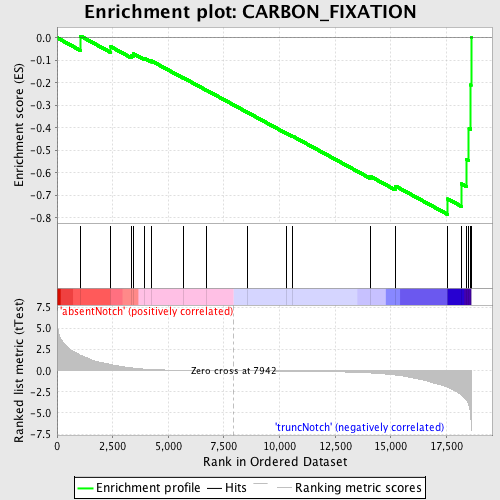
Profile of the Running ES Score & Positions of GeneSet Members on the Rank Ordered List
| Dataset | Set_03_absentNotch_versus_truncNotch.phenotype_absentNotch_versus_truncNotch.cls #absentNotch_versus_truncNotch.phenotype_absentNotch_versus_truncNotch.cls #absentNotch_versus_truncNotch_repos |
| Phenotype | phenotype_absentNotch_versus_truncNotch.cls#absentNotch_versus_truncNotch_repos |
| Upregulated in class | truncNotch |
| GeneSet | CARBON_FIXATION |
| Enrichment Score (ES) | -0.78549796 |
| Normalized Enrichment Score (NES) | -1.6037985 |
| Nominal p-value | 0.009191177 |
| FDR q-value | 0.34754825 |
| FWER p-Value | 0.954 |
| PROBE | DESCRIPTION (from dataset) | GENE SYMBOL | GENE_TITLE | RANK IN GENE LIST | RANK METRIC SCORE | RUNNING ES | CORE ENRICHMENT | |
|---|---|---|---|---|---|---|---|---|
| 1 | PKM2 | 6520403 70500 | 1058 | 1.826 | 0.0074 | No | ||
| 2 | RPIA | 780079 | 2414 | 0.730 | -0.0397 | No | ||
| 3 | ME2 | 5080121 | 3343 | 0.345 | -0.0775 | No | ||
| 4 | TKT | 6590064 6860039 | 3419 | 0.321 | -0.0702 | No | ||
| 5 | GPT2 | 1850463 | 3946 | 0.188 | -0.0919 | No | ||
| 6 | MDH1 | 6660358 6760731 | 4243 | 0.141 | -0.1028 | No | ||
| 7 | PKLR | 1170400 2470114 | 5663 | 0.050 | -0.1774 | No | ||
| 8 | RPE | 940114 | 6719 | 0.022 | -0.2333 | No | ||
| 9 | ALDOB | 4730324 | 8557 | -0.010 | -0.3317 | No | ||
| 10 | GPT | 2350270 | 10298 | -0.043 | -0.4238 | No | ||
| 11 | ALDOC | 450121 610427 | 10595 | -0.050 | -0.4379 | No | ||
| 12 | FBP2 | 1580193 | 14070 | -0.261 | -0.6155 | No | ||
| 13 | MDH2 | 1850601 | 15205 | -0.501 | -0.6589 | No | ||
| 14 | PGK1 | 1570494 630300 | 17561 | -1.960 | -0.7165 | Yes | ||
| 15 | TPI1 | 1500215 2100154 | 18184 | -2.852 | -0.6495 | Yes | ||
| 16 | GOT1 | 2940465 | 18396 | -3.438 | -0.5397 | Yes | ||
| 17 | FBP1 | 1470762 | 18512 | -4.079 | -0.4022 | Yes | ||
| 18 | ALDOA | 6290672 | 18596 | -5.593 | -0.2097 | Yes | ||
| 19 | GOT2 | 4570164 5220450 | 18606 | -5.982 | 0.0005 | Yes |

