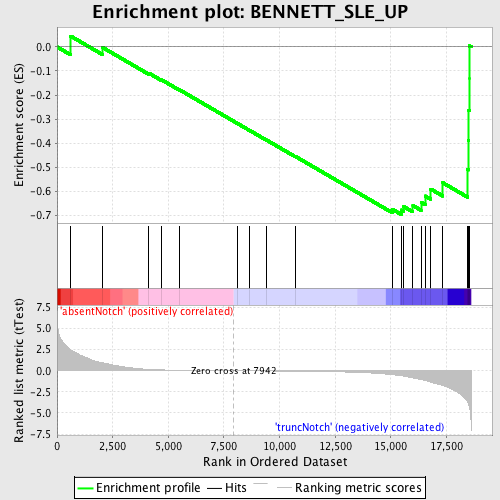
Profile of the Running ES Score & Positions of GeneSet Members on the Rank Ordered List
| Dataset | Set_03_absentNotch_versus_truncNotch.phenotype_absentNotch_versus_truncNotch.cls #absentNotch_versus_truncNotch.phenotype_absentNotch_versus_truncNotch.cls #absentNotch_versus_truncNotch_repos |
| Phenotype | phenotype_absentNotch_versus_truncNotch.cls#absentNotch_versus_truncNotch_repos |
| Upregulated in class | truncNotch |
| GeneSet | BENNETT_SLE_UP |
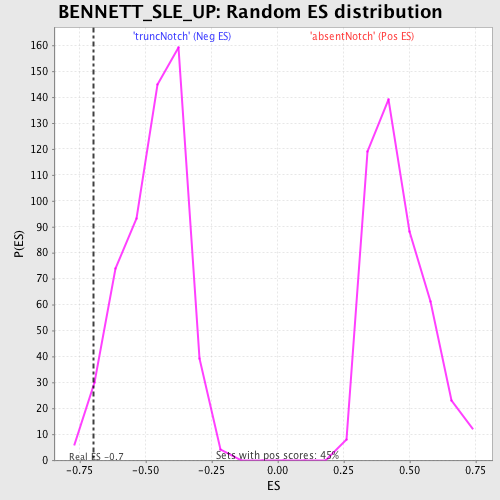
| Enrichment Score (ES) | -0.69669783 |
| Normalized Enrichment Score (NES) | -1.4902308 |
| Nominal p-value | 0.025454545 |
| FDR q-value | 0.6578739 |
| FWER p-Value | 1.0 |
| PROBE | DESCRIPTION (from dataset) | GENE SYMBOL | GENE_TITLE | RANK IN GENE LIST | RANK METRIC SCORE | RUNNING ES | CORE ENRICHMENT | |
|---|---|---|---|---|---|---|---|---|
| 1 | MX2 | 2030373 | 611 | 2.469 | 0.0450 | No | ||
| 2 | MX1 | 2690301 6840364 | 2040 | 0.946 | -0.0020 | No | ||
| 3 | OAS2 | 1230408 | 4117 | 0.158 | -0.1087 | No | ||
| 4 | IFIT3 | 2450278 3190113 6200113 | 4702 | 0.096 | -0.1370 | No | ||
| 5 | CKAP4 | 1050056 | 5507 | 0.055 | -0.1785 | No | ||
| 6 | FPRL1 | 3360451 | 8127 | -0.003 | -0.3193 | No | ||
| 7 | PLSCR1 | 2650301 | 8664 | -0.012 | -0.3478 | No | ||
| 8 | RNASE2 | 3290563 | 9423 | -0.025 | -0.3877 | No | ||
| 9 | TDRD7 | 6550520 | 10721 | -0.053 | -0.4558 | No | ||
| 10 | STAT1 | 6510204 6590553 | 15078 | -0.460 | -0.6756 | No | ||
| 11 | TNFSF10 | 3170300 | 15472 | -0.594 | -0.6780 | Yes | ||
| 12 | S100A8 | 70112 | 15562 | -0.628 | -0.6630 | Yes | ||
| 13 | IFITM3 | 2340358 | 15993 | -0.841 | -0.6596 | Yes | ||
| 14 | LY6E | 5050538 | 16363 | -1.045 | -0.6465 | Yes | ||
| 15 | CAMP | 6290735 | 16547 | -1.160 | -0.6198 | Yes | ||
| 16 | SERPING1 | 5550440 | 16795 | -1.332 | -0.5911 | Yes | ||
| 17 | IRF7 | 1570605 | 17336 | -1.754 | -0.5648 | Yes | ||
| 18 | TAP1 | 4050047 | 18449 | -3.645 | -0.5097 | Yes | ||
| 19 | C2 | 5390465 | 18488 | -3.885 | -0.3893 | Yes | ||
| 20 | ISG15 | 3170093 | 18505 | -4.007 | -0.2638 | Yes | ||
| 21 | IFI35 | 4230739 | 18531 | -4.266 | -0.1307 | Yes | ||
| 22 | LGALS3BP | 840692 | 18534 | -4.289 | 0.0044 | Yes |