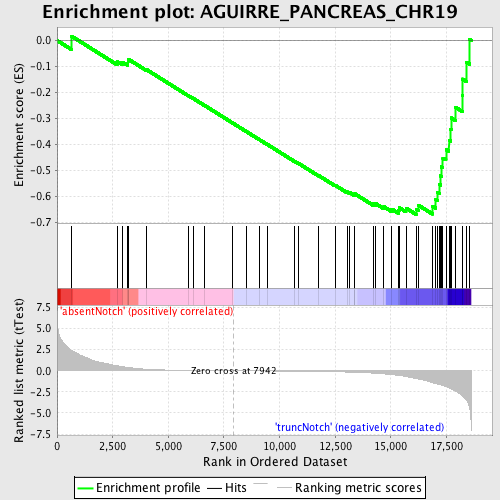
Profile of the Running ES Score & Positions of GeneSet Members on the Rank Ordered List
| Dataset | Set_03_absentNotch_versus_truncNotch.phenotype_absentNotch_versus_truncNotch.cls #absentNotch_versus_truncNotch.phenotype_absentNotch_versus_truncNotch.cls #absentNotch_versus_truncNotch_repos |
| Phenotype | phenotype_absentNotch_versus_truncNotch.cls#absentNotch_versus_truncNotch_repos |
| Upregulated in class | truncNotch |
| GeneSet | AGUIRRE_PANCREAS_CHR19 |
| Enrichment Score (ES) | -0.67094636 |
| Normalized Enrichment Score (NES) | -1.6129975 |
| Nominal p-value | 0.0034662045 |
| FDR q-value | 0.3476218 |
| FWER p-Value | 0.934 |
| PROBE | DESCRIPTION (from dataset) | GENE SYMBOL | GENE_TITLE | RANK IN GENE LIST | RANK METRIC SCORE | RUNNING ES | CORE ENRICHMENT | |
|---|---|---|---|---|---|---|---|---|
| 1 | U2AF2 | 450600 4670128 5420292 | 644 | 2.405 | 0.0169 | No | ||
| 2 | PSMD8 | 630142 | 2699 | 0.584 | -0.0812 | No | ||
| 3 | MRPS12 | 4210707 6110341 | 2930 | 0.486 | -0.0831 | No | ||
| 4 | PRPF31 | 6100360 | 3174 | 0.399 | -0.0877 | No | ||
| 5 | RPL13A | 2680519 5700142 | 3186 | 0.397 | -0.0797 | No | ||
| 6 | PPP5C | 3130047 | 3194 | 0.394 | -0.0717 | No | ||
| 7 | CNOT3 | 130519 4480292 1990609 | 3995 | 0.178 | -0.1109 | No | ||
| 8 | C5AR1 | 4540402 | 5913 | 0.042 | -0.2133 | No | ||
| 9 | DPF1 | 3840435 4540041 | 6132 | 0.036 | -0.2242 | No | ||
| 10 | LIG1 | 1980438 4540112 5570609 | 6646 | 0.024 | -0.2513 | No | ||
| 11 | FUT1 | 1500068 | 7861 | 0.001 | -0.3167 | No | ||
| 12 | FBXO17 | 6020072 | 8509 | -0.009 | -0.3513 | No | ||
| 13 | EHD2 | 6040044 | 9077 | -0.019 | -0.3814 | No | ||
| 14 | LHB | 1450368 | 9476 | -0.026 | -0.4023 | No | ||
| 15 | SYT5 | 4150082 | 10679 | -0.052 | -0.4659 | No | ||
| 16 | NCR1 | 2450026 | 10851 | -0.055 | -0.4740 | No | ||
| 17 | IRF3 | 3290601 5860154 6180162 | 11757 | -0.083 | -0.5209 | No | ||
| 18 | RPL18 | 6380181 3870195 | 12499 | -0.117 | -0.5583 | No | ||
| 19 | GYS1 | 540154 | 13036 | -0.153 | -0.5839 | No | ||
| 20 | PRMT1 | 2850050 | 13126 | -0.160 | -0.5852 | No | ||
| 21 | EML2 | 4060411 | 13361 | -0.179 | -0.5940 | No | ||
| 22 | LENG4 | 2060400 5700487 | 13382 | -0.180 | -0.5912 | No | ||
| 23 | DBP | 4200270 | 14216 | -0.284 | -0.6300 | No | ||
| 24 | KDELR1 | 6760504 | 14325 | -0.302 | -0.6293 | No | ||
| 25 | RUVBL2 | 1190377 | 14692 | -0.369 | -0.6411 | No | ||
| 26 | RCN3 | 5420400 | 15042 | -0.452 | -0.6502 | No | ||
| 27 | NUP62 | 1240128 | 15339 | -0.545 | -0.6545 | Yes | ||
| 28 | SLC1A5 | 670133 3140020 | 15374 | -0.558 | -0.6444 | Yes | ||
| 29 | PPP1R13L | 5220202 | 15683 | -0.678 | -0.6464 | Yes | ||
| 30 | SNRPD2 | 6110035 | 16140 | -0.923 | -0.6511 | Yes | ||
| 31 | HNRPL | 4210593 | 16250 | -0.989 | -0.6358 | Yes | ||
| 32 | SNRP70 | 4200181 | 16874 | -1.416 | -0.6390 | Yes | ||
| 33 | EPN1 | 4060725 | 17017 | -1.507 | -0.6143 | Yes | ||
| 34 | BAX | 3830008 | 17093 | -1.555 | -0.5850 | Yes | ||
| 35 | SIRT2 | 630494 | 17193 | -1.629 | -0.5554 | Yes | ||
| 36 | PLEKHA4 | 4230372 | 17239 | -1.670 | -0.5220 | Yes | ||
| 37 | NFKBIB | 2260167 | 17271 | -1.698 | -0.4872 | Yes | ||
| 38 | NR1H2 | 4070056 | 17340 | -1.757 | -0.4532 | Yes | ||
| 39 | SARS2 | 3190390 | 17481 | -1.887 | -0.4202 | Yes | ||
| 40 | NOSIP | 6290671 6380064 | 17614 | -2.020 | -0.3840 | Yes | ||
| 41 | STRN4 | 3440711 | 17693 | -2.102 | -0.3431 | Yes | ||
| 42 | NUCB1 | 110736 4780131 | 17715 | -2.135 | -0.2984 | Yes | ||
| 43 | MAP4K1 | 4060692 | 17901 | -2.392 | -0.2571 | Yes | ||
| 44 | GRWD1 | 6350528 | 18211 | -2.926 | -0.2109 | Yes | ||
| 45 | PAK4 | 1690152 | 18222 | -2.938 | -0.1484 | Yes | ||
| 46 | NAPA | 1780537 5720102 | 18403 | -3.466 | -0.0838 | Yes | ||
| 47 | TSEN34 | 1450465 | 18548 | -4.437 | 0.0037 | Yes |

