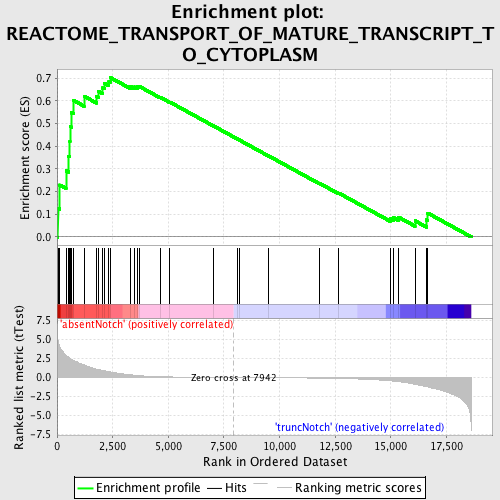
Profile of the Running ES Score & Positions of GeneSet Members on the Rank Ordered List
| Dataset | Set_03_absentNotch_versus_truncNotch.phenotype_absentNotch_versus_truncNotch.cls #absentNotch_versus_truncNotch.phenotype_absentNotch_versus_truncNotch.cls #absentNotch_versus_truncNotch_repos |
| Phenotype | phenotype_absentNotch_versus_truncNotch.cls#absentNotch_versus_truncNotch_repos |
| Upregulated in class | absentNotch |
| GeneSet | REACTOME_TRANSPORT_OF_MATURE_TRANSCRIPT_TO_CYTOPLASM |
| Enrichment Score (ES) | 0.7029744 |
| Normalized Enrichment Score (NES) | 1.6596663 |
| Nominal p-value | 0.0022779044 |
| FDR q-value | 0.19122007 |
| FWER p-Value | 0.634 |

| PROBE | DESCRIPTION (from dataset) | GENE SYMBOL | GENE_TITLE | RANK IN GENE LIST | RANK METRIC SCORE | RUNNING ES | CORE ENRICHMENT | |
|---|---|---|---|---|---|---|---|---|
| 1 | SFRS1 | 2360440 | 39 | 4.846 | 0.1265 | Yes | ||
| 2 | NUP107 | 6380021 | 120 | 4.037 | 0.2293 | Yes | ||
| 3 | SFRS6 | 60224 | 403 | 2.933 | 0.2919 | Yes | ||
| 4 | NUP93 | 2190273 | 517 | 2.684 | 0.3571 | Yes | ||
| 5 | NUP160 | 1990551 | 573 | 2.526 | 0.4211 | Yes | ||
| 6 | NUP155 | 5720576 6220114 | 582 | 2.514 | 0.4874 | Yes | ||
| 7 | U2AF2 | 450600 4670128 5420292 | 644 | 2.405 | 0.5479 | Yes | ||
| 8 | SFRS3 | 770315 4230593 | 747 | 2.240 | 0.6019 | Yes | ||
| 9 | NUP43 | 3360482 | 1214 | 1.656 | 0.6207 | Yes | ||
| 10 | CPSF1 | 6290064 | 1775 | 1.090 | 0.6195 | Yes | ||
| 11 | SFRS7 | 2760408 | 1858 | 1.040 | 0.6427 | Yes | ||
| 12 | THOC4 | 3800731 6400114 | 2049 | 0.939 | 0.6574 | Yes | ||
| 13 | MAGOH | 2370373 5050068 | 2134 | 0.887 | 0.6764 | Yes | ||
| 14 | SFRS5 | 3450176 6350008 | 2327 | 0.778 | 0.6867 | Yes | ||
| 15 | NCBP2 | 5340500 | 2394 | 0.747 | 0.7030 | Yes | ||
| 16 | RAE1 | 7050121 | 3294 | 0.357 | 0.6641 | No | ||
| 17 | NUP37 | 2370097 6370435 6380008 | 3487 | 0.298 | 0.6617 | No | ||
| 18 | EIF4E | 1580403 70133 6380215 | 3604 | 0.264 | 0.6624 | No | ||
| 19 | RANBP2 | 4280338 | 3686 | 0.242 | 0.6645 | No | ||
| 20 | NUPL2 | 6550537 | 4641 | 0.101 | 0.6158 | No | ||
| 21 | NUP54 | 940546 2360156 4060278 | 5060 | 0.073 | 0.5953 | No | ||
| 22 | SLBP | 6220601 | 7013 | 0.016 | 0.4907 | No | ||
| 23 | TPR | 1990066 6550390 | 8112 | -0.003 | 0.4317 | No | ||
| 24 | NUP153 | 7000452 | 8186 | -0.004 | 0.4278 | No | ||
| 25 | NUP188 | 1190470 | 9505 | -0.027 | 0.3576 | No | ||
| 26 | NUP35 | 5340408 | 11789 | -0.084 | 0.2370 | No | ||
| 27 | RNPS1 | 610736 1090021 | 12665 | -0.127 | 0.1933 | No | ||
| 28 | NFX1 | 450504 | 14969 | -0.430 | 0.0808 | No | ||
| 29 | SRRM1 | 6110025 | 15118 | -0.469 | 0.0853 | No | ||
| 30 | NUP62 | 1240128 | 15339 | -0.545 | 0.0879 | No | ||
| 31 | SFRS9 | 3800047 | 16089 | -0.890 | 0.0712 | No | ||
| 32 | U2AF1 | 5130292 | 16605 | -1.199 | 0.0753 | No | ||
| 33 | SFRS2 | 50707 380593 | 16661 | -1.237 | 0.1052 | No |

