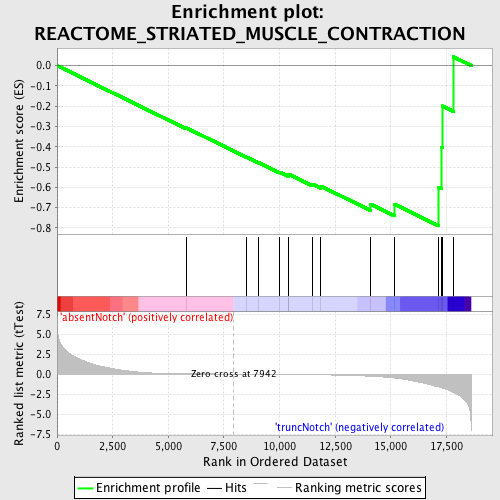
Profile of the Running ES Score & Positions of GeneSet Members on the Rank Ordered List
| Dataset | Set_03_absentNotch_versus_truncNotch.phenotype_absentNotch_versus_truncNotch.cls #absentNotch_versus_truncNotch.phenotype_absentNotch_versus_truncNotch.cls #absentNotch_versus_truncNotch_repos |
| Phenotype | phenotype_absentNotch_versus_truncNotch.cls#absentNotch_versus_truncNotch_repos |
| Upregulated in class | truncNotch |
| GeneSet | REACTOME_STRIATED_MUSCLE_CONTRACTION |
| Enrichment Score (ES) | -0.7904916 |
| Normalized Enrichment Score (NES) | -1.5048614 |
| Nominal p-value | 0.011257036 |
| FDR q-value | 0.45801035 |
| FWER p-Value | 1.0 |
| PROBE | DESCRIPTION (from dataset) | GENE SYMBOL | GENE_TITLE | RANK IN GENE LIST | RANK METRIC SCORE | RUNNING ES | CORE ENRICHMENT | |
|---|---|---|---|---|---|---|---|---|
| 1 | MYL3 | 6040563 | 5814 | 0.045 | -0.3072 | No | ||
| 2 | NEB | 580735 | 8506 | -0.009 | -0.4508 | No | ||
| 3 | MYH6 | 2900373 | 9058 | -0.019 | -0.4782 | No | ||
| 4 | MYBPC2 | 1980368 | 10013 | -0.037 | -0.5250 | No | ||
| 5 | DMD | 1740041 3990332 | 10389 | -0.045 | -0.5399 | No | ||
| 6 | DES | 1450341 | 10402 | -0.045 | -0.5352 | No | ||
| 7 | TNNT2 | 2450364 | 11468 | -0.073 | -0.5837 | No | ||
| 8 | TMOD1 | 3850100 | 11860 | -0.087 | -0.5945 | No | ||
| 9 | TNNC1 | 1990575 | 14097 | -0.265 | -0.6832 | Yes | ||
| 10 | VIM | 20431 | 15151 | -0.483 | -0.6826 | Yes | ||
| 11 | TNNI3 | 7000093 | 17160 | -1.601 | -0.6006 | Yes | ||
| 12 | TPM1 | 130673 | 17289 | -1.716 | -0.4040 | Yes | ||
| 13 | ACTN2 | 4200435 | 17324 | -1.743 | -0.1991 | Yes | ||
| 14 | TCAP | 4890446 | 17816 | -2.264 | 0.0430 | Yes |

