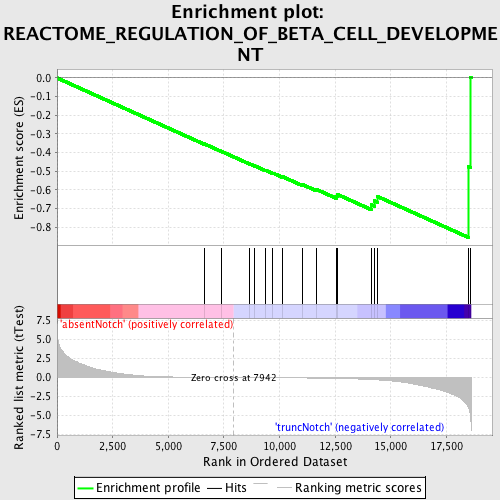
Profile of the Running ES Score & Positions of GeneSet Members on the Rank Ordered List
| Dataset | Set_03_absentNotch_versus_truncNotch.phenotype_absentNotch_versus_truncNotch.cls #absentNotch_versus_truncNotch.phenotype_absentNotch_versus_truncNotch.cls #absentNotch_versus_truncNotch_repos |
| Phenotype | phenotype_absentNotch_versus_truncNotch.cls#absentNotch_versus_truncNotch_repos |
| Upregulated in class | truncNotch |
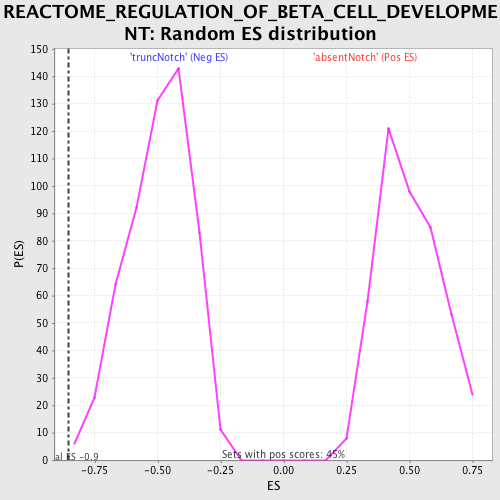
| GeneSet | REACTOME_REGULATION_OF_BETA_CELL_DEVELOPMENT |
| Enrichment Score (ES) | -0.85505587 |
| Normalized Enrichment Score (NES) | -1.7288517 |
| Nominal p-value | 0.0018083183 |
| FDR q-value | 0.036129244 |
| FWER p-Value | 0.116 |
| PROBE | DESCRIPTION (from dataset) | GENE SYMBOL | GENE_TITLE | RANK IN GENE LIST | RANK METRIC SCORE | RUNNING ES | CORE ENRICHMENT | |
|---|---|---|---|---|---|---|---|---|
| 1 | HNF4G | 5720451 | 6615 | 0.025 | -0.3532 | No | ||
| 2 | AKT1 | 5290746 | 7382 | 0.010 | -0.3935 | No | ||
| 3 | PAX4 | 6620619 | 8667 | -0.012 | -0.4613 | No | ||
| 4 | ONECUT3 | 5720487 6100037 | 8882 | -0.015 | -0.4713 | No | ||
| 5 | NKX2-2 | 4150731 | 9365 | -0.024 | -0.4949 | No | ||
| 6 | INSM1 | 3450671 | 9698 | -0.030 | -0.5098 | No | ||
| 7 | PDX1 | 6660647 | 10135 | -0.040 | -0.5294 | No | ||
| 8 | NKX6-1 | 6040731 | 11038 | -0.060 | -0.5720 | No | ||
| 9 | FGF10 | 730458 840706 | 11639 | -0.079 | -0.5966 | No | ||
| 10 | PTF1A | 6450377 | 12559 | -0.121 | -0.6343 | No | ||
| 11 | FOXA3 | 2680121 | 12600 | -0.123 | -0.6244 | No | ||
| 12 | SLC2A2 | 5130537 5720722 6770079 | 14126 | -0.270 | -0.6801 | Yes | ||
| 13 | IAPP | 4230040 | 14262 | -0.292 | -0.6589 | Yes | ||
| 14 | NEUROD1 | 3060619 | 14404 | -0.316 | -0.6356 | Yes | ||
| 15 | HES1 | 4810280 | 18487 | -3.885 | -0.4762 | Yes | ||
| 16 | NOTCH1 | 3390114 | 18581 | -4.954 | 0.0019 | Yes |