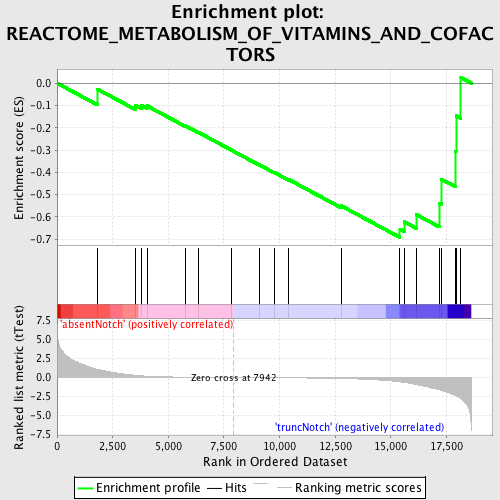
Profile of the Running ES Score & Positions of GeneSet Members on the Rank Ordered List
| Dataset | Set_03_absentNotch_versus_truncNotch.phenotype_absentNotch_versus_truncNotch.cls #absentNotch_versus_truncNotch.phenotype_absentNotch_versus_truncNotch.cls #absentNotch_versus_truncNotch_repos |
| Phenotype | phenotype_absentNotch_versus_truncNotch.cls#absentNotch_versus_truncNotch_repos |
| Upregulated in class | truncNotch |
| GeneSet | REACTOME_METABOLISM_OF_VITAMINS_AND_COFACTORS |
| Enrichment Score (ES) | -0.692041 |
| Normalized Enrichment Score (NES) | -1.4393198 |
| Nominal p-value | 0.048237476 |
| FDR q-value | 0.58251745 |
| FWER p-Value | 1.0 |
| PROBE | DESCRIPTION (from dataset) | GENE SYMBOL | GENE_TITLE | RANK IN GENE LIST | RANK METRIC SCORE | RUNNING ES | CORE ENRICHMENT | |
|---|---|---|---|---|---|---|---|---|
| 1 | CYB5A | 5080450 | 1812 | 1.069 | -0.0268 | No | ||
| 2 | AFMID | 1500398 1770093 1990315 3440056 3520500 6400075 | 3515 | 0.291 | -0.0991 | No | ||
| 3 | FASN | 430717 | 3786 | 0.219 | -0.0991 | No | ||
| 4 | KMO | 7000132 | 4048 | 0.169 | -0.1019 | No | ||
| 5 | MTHFR | 7100253 | 5764 | 0.046 | -0.1911 | No | ||
| 6 | KYNU | 1410435 | 6367 | 0.030 | -0.2215 | No | ||
| 7 | SLC25A16 | 4200341 | 7834 | 0.002 | -0.3002 | No | ||
| 8 | MTHFD1 | 5900398 6520427 | 9117 | -0.020 | -0.3679 | No | ||
| 9 | TDO2 | 6110048 | 9749 | -0.031 | -0.3997 | No | ||
| 10 | HAAO | 430369 450113 | 10421 | -0.046 | -0.4328 | No | ||
| 11 | DHFR | 6350315 | 12770 | -0.135 | -0.5501 | No | ||
| 12 | QPRT | 670270 | 15411 | -0.572 | -0.6542 | Yes | ||
| 13 | ENPP1 | 780609 | 15607 | -0.646 | -0.6220 | Yes | ||
| 14 | SLC19A1 | 6770139 | 16153 | -0.935 | -0.5895 | Yes | ||
| 15 | SHMT1 | 5900132 | 17186 | -1.620 | -0.5379 | Yes | ||
| 16 | CYB5R3 | 430097 6860400 | 17268 | -1.695 | -0.4302 | Yes | ||
| 17 | ACP5 | 2230717 | 17903 | -2.396 | -0.3060 | Yes | ||
| 18 | SLC2A3 | 1990377 | 17930 | -2.432 | -0.1467 | Yes | ||
| 19 | COASY | 6220707 | 18152 | -2.776 | 0.0249 | Yes |

