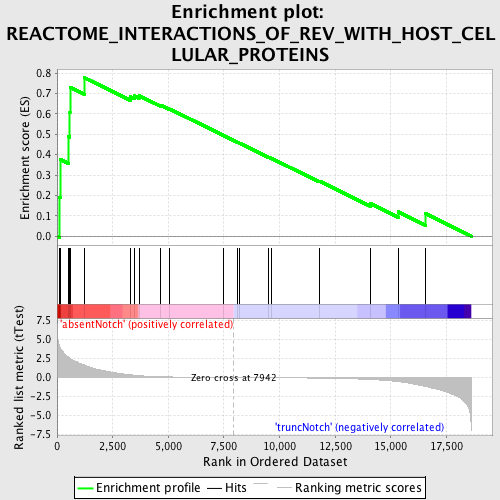
Profile of the Running ES Score & Positions of GeneSet Members on the Rank Ordered List
| Dataset | Set_03_absentNotch_versus_truncNotch.phenotype_absentNotch_versus_truncNotch.cls #absentNotch_versus_truncNotch.phenotype_absentNotch_versus_truncNotch.cls #absentNotch_versus_truncNotch_repos |
| Phenotype | phenotype_absentNotch_versus_truncNotch.cls#absentNotch_versus_truncNotch_repos |
| Upregulated in class | absentNotch |
| GeneSet | REACTOME_INTERACTIONS_OF_REV_WITH_HOST_CELLULAR_PROTEINS |
| Enrichment Score (ES) | 0.77810234 |
| Normalized Enrichment Score (NES) | 1.6703643 |
| Nominal p-value | 0.0 |
| FDR q-value | 0.18596897 |
| FWER p-Value | 0.569 |
| PROBE | DESCRIPTION (from dataset) | GENE SYMBOL | GENE_TITLE | RANK IN GENE LIST | RANK METRIC SCORE | RUNNING ES | CORE ENRICHMENT | |
|---|---|---|---|---|---|---|---|---|
| 1 | NUP107 | 6380021 | 120 | 4.037 | 0.1909 | Yes | ||
| 2 | KPNB1 | 1690138 | 152 | 3.826 | 0.3764 | Yes | ||
| 3 | NUP93 | 2190273 | 517 | 2.684 | 0.4880 | Yes | ||
| 4 | NUP160 | 1990551 | 573 | 2.526 | 0.6086 | Yes | ||
| 5 | NUP155 | 5720576 6220114 | 582 | 2.514 | 0.7311 | Yes | ||
| 6 | NUP43 | 3360482 | 1214 | 1.656 | 0.7781 | Yes | ||
| 7 | RAE1 | 7050121 | 3294 | 0.357 | 0.6838 | No | ||
| 8 | NUP37 | 2370097 6370435 6380008 | 3487 | 0.298 | 0.6880 | No | ||
| 9 | RANBP2 | 4280338 | 3686 | 0.242 | 0.6892 | No | ||
| 10 | NUPL2 | 6550537 | 4641 | 0.101 | 0.6429 | No | ||
| 11 | NUP54 | 940546 2360156 4060278 | 5060 | 0.073 | 0.6240 | No | ||
| 12 | XPO1 | 540707 | 7492 | 0.008 | 0.4936 | No | ||
| 13 | TPR | 1990066 6550390 | 8112 | -0.003 | 0.4605 | No | ||
| 14 | NUP153 | 7000452 | 8186 | -0.004 | 0.4567 | No | ||
| 15 | NUP188 | 1190470 | 9505 | -0.027 | 0.3872 | No | ||
| 16 | RAN | 2260446 4590647 | 9637 | -0.029 | 0.3816 | No | ||
| 17 | NUP35 | 5340408 | 11789 | -0.084 | 0.2700 | No | ||
| 18 | RANBP1 | 430215 1090180 | 14100 | -0.266 | 0.1588 | No | ||
| 19 | NUP62 | 1240128 | 15339 | -0.545 | 0.1189 | No | ||
| 20 | RANGAP1 | 2320593 6650601 | 16567 | -1.171 | 0.1102 | No |

