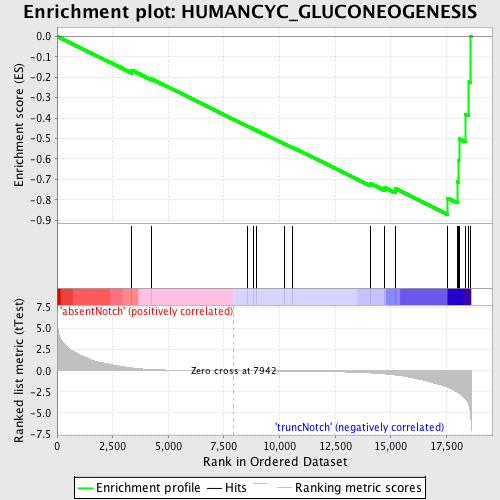
Profile of the Running ES Score & Positions of GeneSet Members on the Rank Ordered List
| Dataset | Set_03_absentNotch_versus_truncNotch.phenotype_absentNotch_versus_truncNotch.cls #absentNotch_versus_truncNotch.phenotype_absentNotch_versus_truncNotch.cls #absentNotch_versus_truncNotch_repos |
| Phenotype | phenotype_absentNotch_versus_truncNotch.cls#absentNotch_versus_truncNotch_repos |
| Upregulated in class | truncNotch |
| GeneSet | HUMANCYC_GLUCONEOGENESIS |
| Enrichment Score (ES) | -0.8718245 |
| Normalized Enrichment Score (NES) | -1.7411431 |
| Nominal p-value | 0.0 |
| FDR q-value | 0.05247805 |
| FWER p-Value | 0.087 |
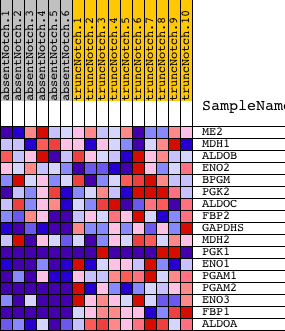
| PROBE | DESCRIPTION (from dataset) | GENE SYMBOL | GENE_TITLE | RANK IN GENE LIST | RANK METRIC SCORE | RUNNING ES | CORE ENRICHMENT | |
|---|---|---|---|---|---|---|---|---|
| 1 | ME2 | 5080121 | 3343 | 0.345 | -0.1656 | No | ||
| 2 | MDH1 | 6660358 6760731 | 4243 | 0.141 | -0.2082 | No | ||
| 3 | ALDOB | 4730324 | 8557 | -0.010 | -0.4397 | No | ||
| 4 | ENO2 | 2320068 | 8820 | -0.015 | -0.4532 | No | ||
| 5 | BPGM | 5080520 | 8961 | -0.017 | -0.4600 | No | ||
| 6 | PGK2 | 2650091 | 10225 | -0.041 | -0.5262 | No | ||
| 7 | ALDOC | 450121 610427 | 10595 | -0.050 | -0.5440 | No | ||
| 8 | FBP2 | 1580193 | 14070 | -0.261 | -0.7201 | No | ||
| 9 | GAPDHS | 2690463 | 14730 | -0.376 | -0.7402 | No | ||
| 10 | MDH2 | 1850601 | 15205 | -0.501 | -0.7452 | No | ||
| 11 | PGK1 | 1570494 630300 | 17561 | -1.960 | -0.7918 | Yes | ||
| 12 | ENO1 | 5340128 | 17995 | -2.530 | -0.7117 | Yes | ||
| 13 | PGAM1 | 2570133 | 18048 | -2.619 | -0.6075 | Yes | ||
| 14 | PGAM2 | 3610605 | 18065 | -2.637 | -0.5007 | Yes | ||
| 15 | ENO3 | 5270136 | 18352 | -3.305 | -0.3810 | Yes | ||
| 16 | FBP1 | 1470762 | 18512 | -4.079 | -0.2229 | Yes | ||
| 17 | ALDOA | 6290672 | 18596 | -5.593 | 0.0011 | Yes |