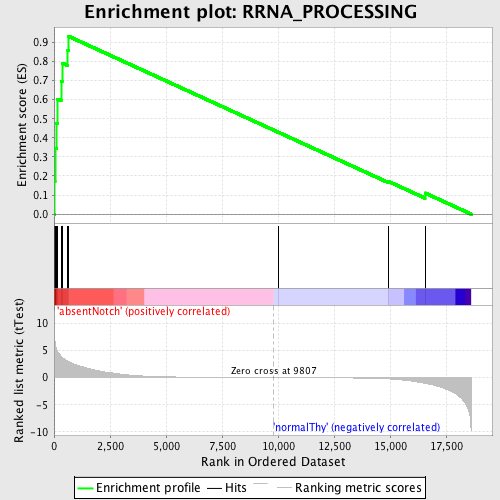
Profile of the Running ES Score & Positions of GeneSet Members on the Rank Ordered List
| Dataset | Set_03_absentNotch_versus_normalThy.phenotype_absentNotch_versus_normalThy.cls #absentNotch_versus_normalThy.phenotype_absentNotch_versus_normalThy.cls #absentNotch_versus_normalThy_repos |
| Phenotype | phenotype_absentNotch_versus_normalThy.cls#absentNotch_versus_normalThy_repos |
| Upregulated in class | absentNotch |
| GeneSet | RRNA_PROCESSING |
| Enrichment Score (ES) | 0.93305117 |
| Normalized Enrichment Score (NES) | 1.6127707 |
| Nominal p-value | 0.0 |
| FDR q-value | 0.09458196 |
| FWER p-Value | 0.748 |
| PROBE | DESCRIPTION (from dataset) | GENE SYMBOL | GENE_TITLE | RANK IN GENE LIST | RANK METRIC SCORE | RUNNING ES | CORE ENRICHMENT | |
|---|---|---|---|---|---|---|---|---|
| 1 | FBL | 5130020 | 37 | 6.713 | 0.1733 | Yes | ||
| 2 | NOLA2 | 4060167 | 41 | 6.591 | 0.3452 | Yes | ||
| 3 | NOLC1 | 2350195 | 110 | 5.205 | 0.4775 | Yes | ||
| 4 | RRP9 | 630451 | 148 | 4.877 | 0.6028 | Yes | ||
| 5 | NOL5A | 5570139 | 312 | 3.941 | 0.6969 | Yes | ||
| 6 | EXOSC2 | 6900471 | 358 | 3.727 | 0.7918 | Yes | ||
| 7 | EXOSC7 | 520538 | 615 | 2.995 | 0.8563 | Yes | ||
| 8 | POP4 | 4560600 | 628 | 2.966 | 0.9331 | Yes | ||
| 9 | EXOSC3 | 1740064 | 10037 | -0.004 | 0.4275 | No | ||
| 10 | RPS14 | 430541 | 14945 | -0.249 | 0.1703 | No | ||
| 11 | GEMIN4 | 130278 2230075 | 16557 | -1.033 | 0.1107 | No |

