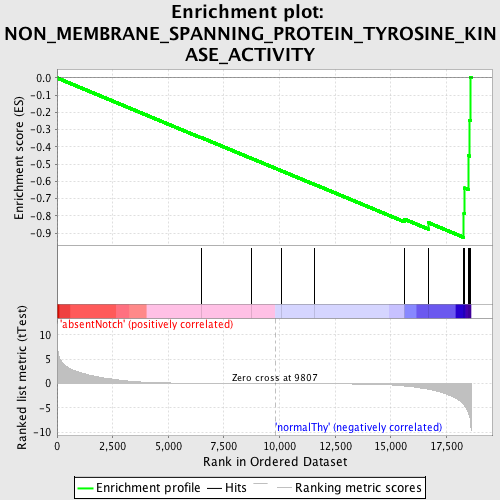
Profile of the Running ES Score & Positions of GeneSet Members on the Rank Ordered List
| Dataset | Set_03_absentNotch_versus_normalThy.phenotype_absentNotch_versus_normalThy.cls #absentNotch_versus_normalThy.phenotype_absentNotch_versus_normalThy.cls #absentNotch_versus_normalThy_repos |
| Phenotype | phenotype_absentNotch_versus_normalThy.cls#absentNotch_versus_normalThy_repos |
| Upregulated in class | normalThy |
| GeneSet | NON_MEMBRANE_SPANNING_PROTEIN_TYROSINE_KINASE_ACTIVITY |
| Enrichment Score (ES) | -0.9258155 |
| Normalized Enrichment Score (NES) | -1.6297256 |
| Nominal p-value | 0.0 |
| FDR q-value | 0.27120978 |
| FWER p-Value | 0.661 |
| PROBE | DESCRIPTION (from dataset) | GENE SYMBOL | GENE_TITLE | RANK IN GENE LIST | RANK METRIC SCORE | RUNNING ES | CORE ENRICHMENT | |
|---|---|---|---|---|---|---|---|---|
| 1 | ERBB2 | 3830673 | 6485 | 0.062 | -0.3465 | No | ||
| 2 | TXK | 2320338 | 8747 | 0.016 | -0.4675 | No | ||
| 3 | PTK6 | 6860735 | 10097 | -0.005 | -0.5399 | No | ||
| 4 | FRK | 5130333 | 11590 | -0.029 | -0.6191 | No | ||
| 5 | CLK1 | 1780551 2100102 2340347 2480347 | 15606 | -0.475 | -0.8194 | No | ||
| 6 | TYK2 | 1660465 1740736 | 16700 | -1.152 | -0.8406 | Yes | ||
| 7 | DYRK1A | 3190181 | 18286 | -4.333 | -0.7847 | Yes | ||
| 8 | TNK2 | 1570390 | 18317 | -4.531 | -0.6386 | Yes | ||
| 9 | ITK | 2230592 | 18492 | -6.023 | -0.4518 | Yes | ||
| 10 | PTK2B | 4730411 | 18527 | -6.405 | -0.2449 | Yes | ||
| 11 | TEC | 1400576 | 18580 | -7.663 | 0.0019 | Yes |

