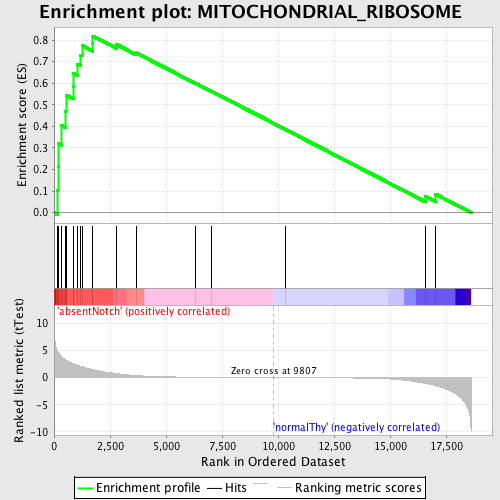
Profile of the Running ES Score & Positions of GeneSet Members on the Rank Ordered List
| Dataset | Set_03_absentNotch_versus_normalThy.phenotype_absentNotch_versus_normalThy.cls #absentNotch_versus_normalThy.phenotype_absentNotch_versus_normalThy.cls #absentNotch_versus_normalThy_repos |
| Phenotype | phenotype_absentNotch_versus_normalThy.cls#absentNotch_versus_normalThy_repos |
| Upregulated in class | absentNotch |
| GeneSet | MITOCHONDRIAL_RIBOSOME |
| Enrichment Score (ES) | 0.8185515 |
| Normalized Enrichment Score (NES) | 1.6238539 |
| Nominal p-value | 0.004149378 |
| FDR q-value | 0.08127792 |
| FWER p-Value | 0.677 |
| PROBE | DESCRIPTION (from dataset) | GENE SYMBOL | GENE_TITLE | RANK IN GENE LIST | RANK METRIC SCORE | RUNNING ES | CORE ENRICHMENT | |
|---|---|---|---|---|---|---|---|---|
| 1 | MRPS15 | 3840280 5360504 | 164 | 4.763 | 0.1042 | Yes | ||
| 2 | MRPS28 | 2230373 | 175 | 4.681 | 0.2147 | Yes | ||
| 3 | MRPL12 | 3120112 | 204 | 4.467 | 0.3192 | Yes | ||
| 4 | MRPL55 | 2260075 | 331 | 3.835 | 0.4034 | Yes | ||
| 5 | MRPS24 | 5340022 | 513 | 3.228 | 0.4703 | Yes | ||
| 6 | MRPS18A | 6770433 | 534 | 3.181 | 0.5447 | Yes | ||
| 7 | MRPS11 | 3130270 6660735 | 856 | 2.512 | 0.5871 | Yes | ||
| 8 | MRPS12 | 4210707 6110341 | 863 | 2.507 | 0.6462 | Yes | ||
| 9 | MRPS10 | 2060315 4880300 6040047 | 1060 | 2.230 | 0.6886 | Yes | ||
| 10 | MRPS35 | 2370603 4070551 | 1190 | 2.073 | 0.7309 | Yes | ||
| 11 | MRPS18C | 6760044 | 1251 | 1.995 | 0.7750 | Yes | ||
| 12 | MRPS16 | 2510390 | 1729 | 1.465 | 0.7841 | Yes | ||
| 13 | MRPL10 | 4120484 | 1733 | 1.460 | 0.8186 | Yes | ||
| 14 | MRPL52 | 1170204 | 2775 | 0.732 | 0.7799 | No | ||
| 15 | MRPL51 | 540670 1580026 | 3665 | 0.363 | 0.7408 | No | ||
| 16 | MRPL40 | 2370215 | 6304 | 0.068 | 0.6005 | No | ||
| 17 | MRPS22 | 5910458 | 7026 | 0.047 | 0.5629 | No | ||
| 18 | MRPS36 | 7050072 | 10321 | -0.008 | 0.3859 | No | ||
| 19 | MRPS21 | 2650008 | 16579 | -1.046 | 0.0743 | No | ||
| 20 | MRPL23 | 4070142 | 17028 | -1.483 | 0.0854 | No |

