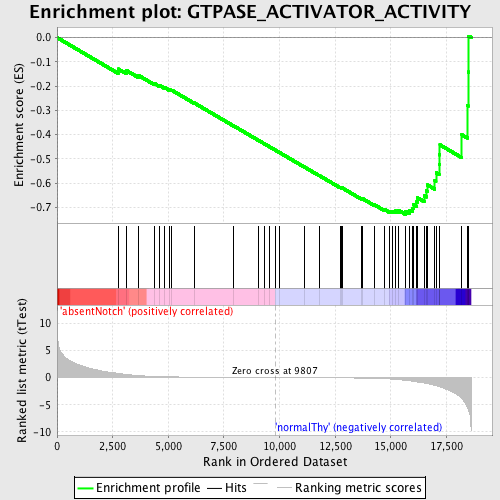
Profile of the Running ES Score & Positions of GeneSet Members on the Rank Ordered List
| Dataset | Set_03_absentNotch_versus_normalThy.phenotype_absentNotch_versus_normalThy.cls #absentNotch_versus_normalThy.phenotype_absentNotch_versus_normalThy.cls #absentNotch_versus_normalThy_repos |
| Phenotype | phenotype_absentNotch_versus_normalThy.cls#absentNotch_versus_normalThy_repos |
| Upregulated in class | normalThy |
| GeneSet | GTPASE_ACTIVATOR_ACTIVITY |
| Enrichment Score (ES) | -0.7298117 |
| Normalized Enrichment Score (NES) | -1.6710957 |
| Nominal p-value | 0.003960396 |
| FDR q-value | 0.45529348 |
| FWER p-Value | 0.381 |
| PROBE | DESCRIPTION (from dataset) | GENE SYMBOL | GENE_TITLE | RANK IN GENE LIST | RANK METRIC SCORE | RUNNING ES | CORE ENRICHMENT | |
|---|---|---|---|---|---|---|---|---|
| 1 | ARFGEF1 | 6760494 | 2744 | 0.751 | -0.1294 | No | ||
| 2 | CENTA1 | 2360128 5220037 | 3130 | 0.555 | -0.1366 | No | ||
| 3 | ABR | 610079 1170609 3610195 5670050 | 3658 | 0.365 | -0.1561 | No | ||
| 4 | BCR | 2260020 4230180 6040195 | 4378 | 0.208 | -0.1897 | No | ||
| 5 | RACGAP1 | 3990162 6620736 | 4622 | 0.175 | -0.1985 | No | ||
| 6 | RABGAP1 | 5050397 | 4830 | 0.151 | -0.2060 | No | ||
| 7 | RGS2 | 1090736 | 5060 | 0.132 | -0.2151 | No | ||
| 8 | RGS20 | 4540541 4730086 | 5148 | 0.124 | -0.2168 | No | ||
| 9 | DOCK4 | 5910102 | 6159 | 0.073 | -0.2694 | No | ||
| 10 | RASGRP3 | 6020504 | 7944 | 0.029 | -0.3647 | No | ||
| 11 | DEPDC2 | 5220102 | 9067 | 0.011 | -0.4249 | No | ||
| 12 | ALDH1A1 | 6520706 | 9305 | 0.007 | -0.4375 | No | ||
| 13 | RGS11 | 2360041 | 9565 | 0.004 | -0.4513 | No | ||
| 14 | RGS4 | 2970711 | 9811 | -0.000 | -0.4645 | No | ||
| 15 | ARHGAP5 | 2510619 3360035 | 9991 | -0.003 | -0.4741 | No | ||
| 16 | SOS1 | 7050338 | 11112 | -0.021 | -0.5339 | No | ||
| 17 | RGS1 | 4060347 4540181 | 11777 | -0.033 | -0.5688 | No | ||
| 18 | NF1 | 6980433 | 12727 | -0.057 | -0.6185 | No | ||
| 19 | DLC1 | 1090632 6450594 | 12770 | -0.058 | -0.6194 | No | ||
| 20 | OPHN1 | 2360100 | 12807 | -0.059 | -0.6198 | No | ||
| 21 | RGS9 | 1050273 | 13695 | -0.098 | -0.6652 | No | ||
| 22 | RGS12 | 1190082 5390369 | 13743 | -0.101 | -0.6653 | No | ||
| 23 | ARHGAP10 | 510086 780324 | 14245 | -0.142 | -0.6888 | No | ||
| 24 | TSC2 | 1450494 | 14721 | -0.201 | -0.7095 | No | ||
| 25 | CDC42EP2 | 540079 2970138 | 14952 | -0.251 | -0.7157 | No | ||
| 26 | CHN2 | 870528 | 15091 | -0.289 | -0.7161 | No | ||
| 27 | RGS6 | 6040601 | 15221 | -0.328 | -0.7150 | No | ||
| 28 | CENTD2 | 60408 2510156 6100494 | 15353 | -0.373 | -0.7130 | No | ||
| 29 | RASAL1 | 3710112 | 15667 | -0.506 | -0.7175 | Yes | ||
| 30 | VAV3 | 1050731 2450242 2680653 | 15836 | -0.584 | -0.7122 | Yes | ||
| 31 | RASA4 | 110296 4200114 | 15964 | -0.653 | -0.7031 | Yes | ||
| 32 | GMIP | 6980193 | 16022 | -0.687 | -0.6894 | Yes | ||
| 33 | RASA2 | 7100706 | 16153 | -0.761 | -0.6779 | Yes | ||
| 34 | RGS3 | 60670 540736 1340180 1500369 3390735 4010131 4610402 6380114 | 16187 | -0.788 | -0.6604 | Yes | ||
| 35 | BNIP2 | 1410475 6770088 | 16500 | -1.000 | -0.6528 | Yes | ||
| 36 | RALBP1 | 4780632 | 16595 | -1.057 | -0.6320 | Yes | ||
| 37 | THY1 | 5910162 | 16644 | -1.101 | -0.6077 | Yes | ||
| 38 | RGS16 | 780091 | 16978 | -1.426 | -0.5908 | Yes | ||
| 39 | ARFGAP3 | 3390717 | 17031 | -1.485 | -0.5574 | Yes | ||
| 40 | RASA1 | 1240315 | 17172 | -1.670 | -0.5241 | Yes | ||
| 41 | RANGAP1 | 2320593 6650601 | 17194 | -1.699 | -0.4838 | Yes | ||
| 42 | SIPA1 | 5220687 | 17208 | -1.715 | -0.4426 | Yes | ||
| 43 | RASA3 | 2060465 | 18191 | -3.864 | -0.4011 | Yes | ||
| 44 | MYO9B | 1230435 3060358 | 18443 | -5.482 | -0.2808 | Yes | ||
| 45 | RGS14 | 380086 | 18476 | -5.763 | -0.1417 | Yes | ||
| 46 | ARHGAP4 | 1940022 | 18504 | -6.111 | 0.0060 | Yes |

