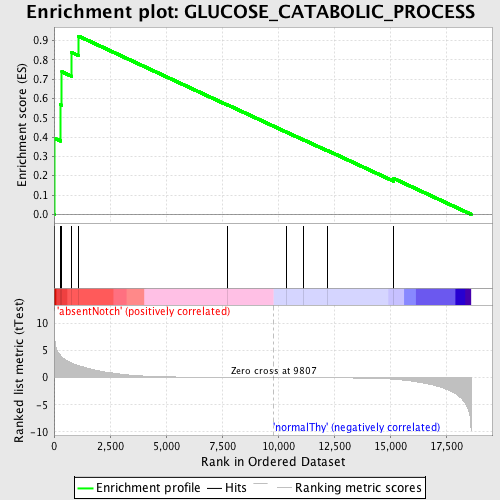
Profile of the Running ES Score & Positions of GeneSet Members on the Rank Ordered List
| Dataset | Set_03_absentNotch_versus_normalThy.phenotype_absentNotch_versus_normalThy.cls #absentNotch_versus_normalThy.phenotype_absentNotch_versus_normalThy.cls #absentNotch_versus_normalThy_repos |
| Phenotype | phenotype_absentNotch_versus_normalThy.cls#absentNotch_versus_normalThy_repos |
| Upregulated in class | absentNotch |
| GeneSet | GLUCOSE_CATABOLIC_PROCESS |
| Enrichment Score (ES) | 0.9221837 |
| Normalized Enrichment Score (NES) | 1.5839338 |
| Nominal p-value | 0.0020491802 |
| FDR q-value | 0.12209092 |
| FWER p-Value | 0.905 |
| PROBE | DESCRIPTION (from dataset) | GENE SYMBOL | GENE_TITLE | RANK IN GENE LIST | RANK METRIC SCORE | RUNNING ES | CORE ENRICHMENT | |
|---|---|---|---|---|---|---|---|---|
| 1 | PFKM | 1990156 5720168 | 11 | 8.531 | 0.3940 | Yes | ||
| 2 | PFKL | 6200167 | 286 | 4.057 | 0.5670 | Yes | ||
| 3 | ALDOA | 6290672 | 348 | 3.761 | 0.7377 | Yes | ||
| 4 | PGD | 6840048 | 778 | 2.666 | 0.8379 | Yes | ||
| 5 | PGLS | 2120324 | 1094 | 2.187 | 0.9222 | Yes | ||
| 6 | TKTL1 | 2810672 6760102 | 7745 | 0.033 | 0.5663 | No | ||
| 7 | GAPDHS | 2690463 | 10368 | -0.009 | 0.4258 | No | ||
| 8 | ALDOB | 4730324 | 11143 | -0.021 | 0.3852 | No | ||
| 9 | PFKFB1 | 2370128 | 12210 | -0.043 | 0.3299 | No | ||
| 10 | HK1 | 4280402 | 15163 | -0.310 | 0.1856 | No |

