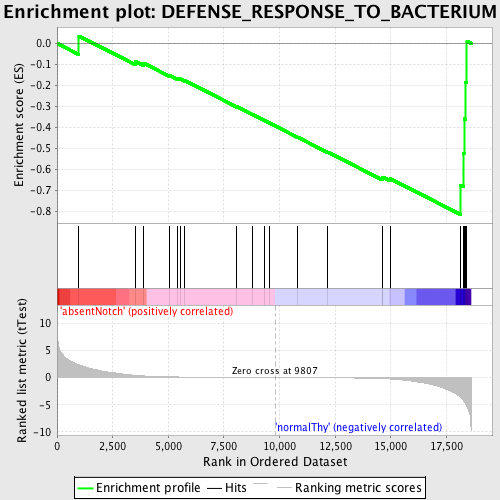
Profile of the Running ES Score & Positions of GeneSet Members on the Rank Ordered List
| Dataset | Set_03_absentNotch_versus_normalThy.phenotype_absentNotch_versus_normalThy.cls #absentNotch_versus_normalThy.phenotype_absentNotch_versus_normalThy.cls #absentNotch_versus_normalThy_repos |
| Phenotype | phenotype_absentNotch_versus_normalThy.cls#absentNotch_versus_normalThy_repos |
| Upregulated in class | normalThy |
| GeneSet | DEFENSE_RESPONSE_TO_BACTERIUM |
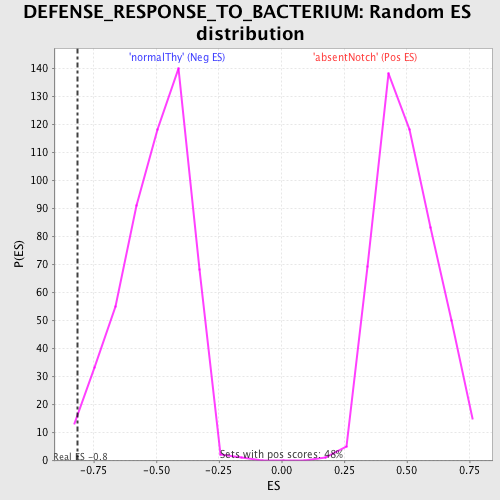
| Enrichment Score (ES) | -0.81537783 |
| Normalized Enrichment Score (NES) | -1.6175183 |
| Nominal p-value | 0.009596929 |
| FDR q-value | 0.23102294 |
| FWER p-Value | 0.75 |
| PROBE | DESCRIPTION (from dataset) | GENE SYMBOL | GENE_TITLE | RANK IN GENE LIST | RANK METRIC SCORE | RUNNING ES | CORE ENRICHMENT | |
|---|---|---|---|---|---|---|---|---|
| 1 | CFP | 2100619 | 981 | 2.320 | 0.0350 | No | ||
| 2 | STAB1 | 5390707 | 3525 | 0.410 | -0.0862 | No | ||
| 3 | IL12A | 7100551 | 3870 | 0.305 | -0.0932 | No | ||
| 4 | TLR6 | 510102 3390148 | 5055 | 0.132 | -0.1519 | No | ||
| 5 | PGLYRP4 | 3780411 | 5392 | 0.108 | -0.1659 | No | ||
| 6 | DEFB103A | 50014 | 5523 | 0.100 | -0.1691 | No | ||
| 7 | NLRC4 | 5570332 | 5744 | 0.089 | -0.1775 | No | ||
| 8 | SPACA3 | 1850161 | 8084 | 0.027 | -0.3023 | No | ||
| 9 | PGLYRP3 | 6350403 | 8774 | 0.016 | -0.3388 | No | ||
| 10 | WFDC12 | 6980647 | 9330 | 0.007 | -0.3683 | No | ||
| 11 | TLR3 | 6760451 | 9563 | 0.004 | -0.3807 | No | ||
| 12 | LALBA | 6940685 | 10823 | -0.016 | -0.4478 | No | ||
| 13 | DMBT1 | 7050270 | 12154 | -0.042 | -0.5177 | No | ||
| 14 | STAB2 | 4810452 | 14625 | -0.187 | -0.6435 | No | ||
| 15 | DEFB127 | 520564 | 14632 | -0.188 | -0.6367 | No | ||
| 16 | NOD2 | 2510050 | 14972 | -0.257 | -0.6452 | No | ||
| 17 | CAMP | 6290735 | 18138 | -3.658 | -0.6770 | Yes | ||
| 18 | PGLYRP2 | 2340086 | 18268 | -4.227 | -0.5240 | Yes | ||
| 19 | SPN | 3520338 3870671 | 18293 | -4.381 | -0.3596 | Yes | ||
| 20 | NOD1 | 2360368 | 18350 | -4.710 | -0.1844 | Yes | ||
| 21 | PGLYRP1 | 6760242 | 18423 | -5.252 | 0.0104 | Yes |